Fuel Economy Comparison Calculator
Put two vehicles head to head to see gallons or liters burned per year, annual fuel cost, cost per mile, yearly savings, and a multi-year projection in MPG or L/100km.
🚗Real Comparison Presets
📝Comparison Inputs
Switch the unit system to price per liter for metric.
🔢Formula Snapshot
📊Annual Fuel Cost by MPG
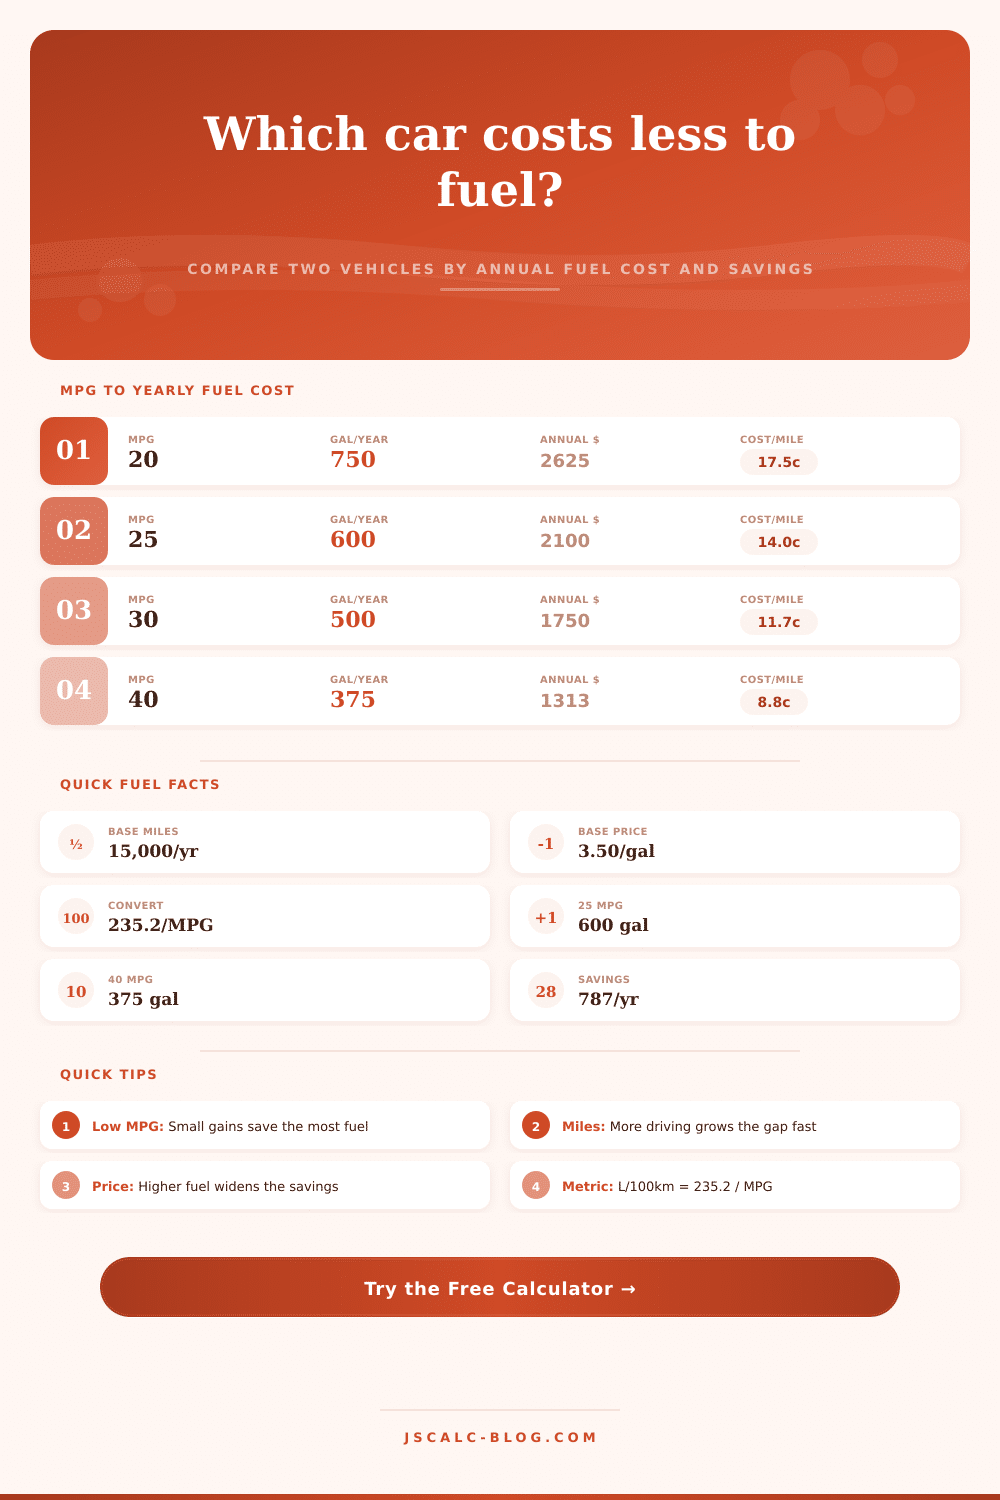
Based on 15,000 miles per year at $3.50 per gallon. Cost per mile is fuel price divided by MPG.
| MPG | L/100km | Gallons / Year | Annual Cost | Cost / Mile | vs 25 MPG |
|---|---|---|---|---|---|
| 15 | 15.7 | 1,000 | $3,500 | 23.3¢ | −$1,400 |
| 18 | 13.1 | 833 | $2,917 | 19.4¢ | −$817 |
| 20 | 11.8 | 750 | $2,625 | 17.5¢ | −$525 |
| 25 | 9.4 | 600 | $2,100 | 14.0¢ | $0 |
| 30 | 7.8 | 500 | $1,750 | 11.7¢ | +$350 |
| 35 | 6.7 | 429 | $1,500 | 10.0¢ | +$600 |
| 40 | 5.9 | 375 | $1,313 | 8.8¢ | +$788 |
| 50 | 4.7 | 300 | $1,050 | 7.0¢ | +$1,050 |
| 60 | 3.9 | 250 | $875 | 5.8¢ | +$1,225 |
🗂MPG to L/100km Conversion
| MPG (US) | L/100km | km / Liter | Miles / Liter | Rating |
|---|---|---|---|---|
| 15 MPG | 15.68 | 6.4 | 3.96 | Thirsty |
| 20 MPG | 11.76 | 8.5 | 5.28 | Below average |
| 25 MPG | 9.41 | 10.6 | 6.60 | Average |
| 30 MPG | 7.84 | 12.8 | 7.92 | Good |
| 35 MPG | 6.72 | 14.9 | 9.24 | Very good |
| 40 MPG | 5.88 | 17.0 | 10.56 | Efficient |
| 50 MPG | 4.70 | 21.3 | 13.20 | Hybrid class |
🛻Typical Vehicle MPG
| Vehicle Type | Typical MPG | L/100km | Annual Gallons | Annual Cost |
|---|---|---|---|---|
| Full-size truck | 18 | 13.1 | 833 | $2,917 |
| Large SUV | 20 | 11.8 | 750 | $2,625 |
| Midsize SUV | 26 | 9.0 | 577 | $2,019 |
| Family sedan | 32 | 7.4 | 469 | $1,641 |
| Compact car | 36 | 6.5 | 417 | $1,458 |
| Hybrid sedan | 50 | 4.7 | 300 | $1,050 |
| Plug-in hybrid | 55 | 4.3 | 273 | $955 |
⚖MPG Comparison Grid vs 25 MPG
Reference grid at 15,000 miles per year and $3.50 per gallon. Savings compare each row against a 25 MPG baseline.
| MPG | Gallons / Year | Annual Cost | Cost / Mile | vs 25 MPG | 5-Year Gap |
|---|---|---|---|---|---|
| 16 | 938 | $3,281 | 21.9¢ | −$1,181 | −$5,906 |
| 22 | 682 | $2,386 | 15.9¢ | −$286 | −$1,432 |
| 25 | 600 | $2,100 | 14.0¢ | $0 | $0 |
| 28 | 536 | $1,875 | 12.5¢ | +$225 | +$1,125 |
| 33 | 455 | $1,591 | 10.6¢ | +$509 | +$2,545 |
| 35 | 429 | $1,500 | 10.0¢ | +$600 | +$3,000 |
| 40 | 375 | $1,313 | 8.8¢ | +$788 | +$3,938 |
| 45 | 333 | $1,167 | 7.8¢ | +$933 | +$4,667 |
| 50 | 300 | $1,050 | 7.0¢ | +$1,050 | +$5,250 |
⚙Full Formula Breakdown
📋Reference Values
| Item | Common Range | How It Is Used | Effect on Savings |
|---|---|---|---|
| Annual distance | 8,000 to 30,000 mi | Miles ÷ MPG for gallons | More miles widens the gap |
| Fuel price | $2.80 to $5.50/gal | Multiplies gallons used | Higher price raises savings |
| Vehicle A MPG | 15 to 60 MPG | Sets gallons for car A | Lower MPG costs more |
| Vehicle B MPG | 15 to 60 MPG | Sets gallons for car B | Higher MPG saves more |
| Years horizon | 1 to 10 years | Multiplies annual savings | Longer term stacks savings |
💡Practical Comparison Tips
For most drivers, fuel economy is a simple game of who can get highest MPG number posted on their window sticker. It looks nice and linear, but then you try to convert it to real-world dollars coming out of your bank account each week. Because fuel efficiency isnt linear, even small difference in mileage are far greater on the low end than on the high end. When people trade in for a newer car they mostly don’t realize this. Getting your gas mileage from fifteen MPG to twenty MPG will save you a lot more gas and money then getting it from forty MPG to fifty MPG.
Your car doesn’t care if you feel great inside, all it cares about is how much liquid it need to slurp up to move your weight down the road. But it’s not just about the rating, you want to know total cost. Enter your gas price, mileage and annual driving distance into calculator above and let it do the math. The sticker shock goes away as it tells you in plain language how many liters (or gallons) of fuel any given car will consume during a year. It takes into account your driving range, current gas price, and other factors that vary from year-to-year.
Why MPG Numbers Are Misleading
Sure, hybrids may be more expensive up-front. But if you drive 30k miles a year, they’ll pay for themselves in fuel savings faster than car driven 10k miles a year. The calculator does this calculation automatically so you can view the long-term picture: what is the five-ten year outlook? It is not just snapshot of one year. These variances are multiplied by fuel prices.
A sedan that gets 25 miles to the gallon and a truck that gets 18 may seem like a small difference when gasoline is cheap. But if gas hits five bucks a gallon, that little number will become one-hundred-buck-a-month-or-more difference. And there’s no predicting the market for oil, but there’s always planning for it; knowing where your wallet’s at risk. Having some sense of how much a small reduction in mpg matters helps you know what to look for next time you need to buy new car.
This is also where driving style enter the equation a lot. Most people don’t drive like they do during EPA testing, which is an idealized condition. Excessive speed, aggressive acceleration, and lots of idling will bring actual MPG to lower levels different than what’s listed in the EPA’s numbers. Aerodynamic drag kills efficiency. If you cruise at 75 mph on the highway for your commute, you will lose efficiency regardless of how good engine looks on paper.
Because it’s all about volume here, annual distance is one of the main inputs into the calculator. Even though car might burn a little more fuel, if you rarely drive then it might end up being the cheaper vehicle when all is said and done. On the other hand, if you spend a lot of time on the road, those tenths of a mile per gallon adds up over time and count towards your bottom line.
For drivers accustomed to the imperial system, it might also add an extra layer of confusion. While miles-per-gallon is direct, liters-per-one-hundred-kilometers works the opposite way; a higher number isn’t better, but a lower one is. That inverse nature often stumbles consumer who want to compare vehicles across markets. The tool helps with that, too: It provides a button for toggling between units so no matter what your country’s unit system, you’re still comparing apples-to-apples. You don’t need to remember the 235.2 conversion factor to understand the savings.
But at the end of the day, buying a car comes down to balancing monthly payments with long-term operating costs. Sipping gas in the moderately priced sedan may be cheaper than guzzling gas in the bargain-basement beater. Small daily inefficiencies becomes big annual expenses. Plug in what you do and pay attention to what you drive. Change the gas price or change the miles driven each year and see how the math changes. It gets real, and helps you make real financial choices based off numbers rather than abstract ratings.
What you discover could of that the expensive car is really the right move; or that your old clunker isn’t such a bad idea after all. Gas mileage is part of the equation, but it’s a big part that holds down your overall cost of ownership. Let the numbers lead you. Let them help you avoid the emotional decision-making process (because, hey, who doesn’t like being led by their emotions?). Your ego won’t matter to the pump, but your gallons will.