Fix and Flip Profit Calculator
Estimate all-in project cost, sale proceeds, net profit, ROI, annualized ROI, and deal margin before committing to a flip.
🏚 Deal presets
📝 Project inputs
Used for interest, points, and cash invested.
Calculation breakdown
📊 Cost component grid
📈 Profit sensitivity table
| Scenario | Resale change | Rehab change | Hold months | Estimated profit |
|---|---|---|---|---|
| Base case | 0% | 0% | 5.0 | $0 |
| Soft sale | -3% | 0% | 5.0 | $0 |
| Overrun | 0% | +10% | 5.0 | $0 |
| Long hold | 0% | 0% | 7.0 | $0 |
| Best case | +3% | -5% | 4.0 | $0 |
| Stress test | -5% | +15% | 8.0 | $0 |
💳 Financing reference table
| Loan style | Loan amount | Rate | Points | Interest note |
|---|---|---|---|---|
| Cash purchase | $0 | 0% | 0% | No loan interest |
| Private loan | 60% to 75% LTC | 8% to 12% | 0 to 2 | Often flexible |
| Hard money | 70% to 90% LTC | 10% to 15% | 1 to 4 | Common flip debt |
| Bridge loan | 65% to 80% LTV | 9% to 13% | 1 to 3 | Short timeline |
| Portfolio line | Custom limit | 7% to 11% | 0 to 1 | Repeat borrower |
| Mixed funding | Senior + cash | Blended | Blended | Track each layer |
⏱ Holding-cost table
| Timeline | Typical use | Monthly holding | Risk level | Check before offer |
|---|---|---|---|---|
| 2 to 3 months | Paint and floors | Low | Lower | Fast crews |
| 4 to 6 months | Standard rehab | Moderate | Normal | Permit timing |
| 7 to 9 months | Systems work | High | Elevated | Cash reserve |
| 10 to 12 months | Major rebuild | Very high | High | Loan maturity |
| Listing delay | Slow resale | Add 1 to 2 mo | Market | Active comps |
| Permit delay | City review | Add 1 to 3 mo | Process | Local backlog |
🧮 Formula table
| Metric | Formula | Includes | Use | Watch item |
|---|---|---|---|---|
| Rehab with cushion | Rehab x (1 + contingency) | Base + buffer | Scope risk | Hidden work |
| Holding cost | Months x monthly hold | Taxes, utilities | Timeline risk | Slow crews |
| Financing cost | Interest + points | Loan charges | Debt cost | Extensions |
| Total project cost | Buy + rehab + hold + finance + costs | All outlays | All-in basis | Missing fees |
| Net profit | Resale - total cost | Exit result | Deal screen | ARV miss |
| Annualized ROI | ROI x 12 / months | Time factor | Compare deals | Short holds |
💡 Flip tips
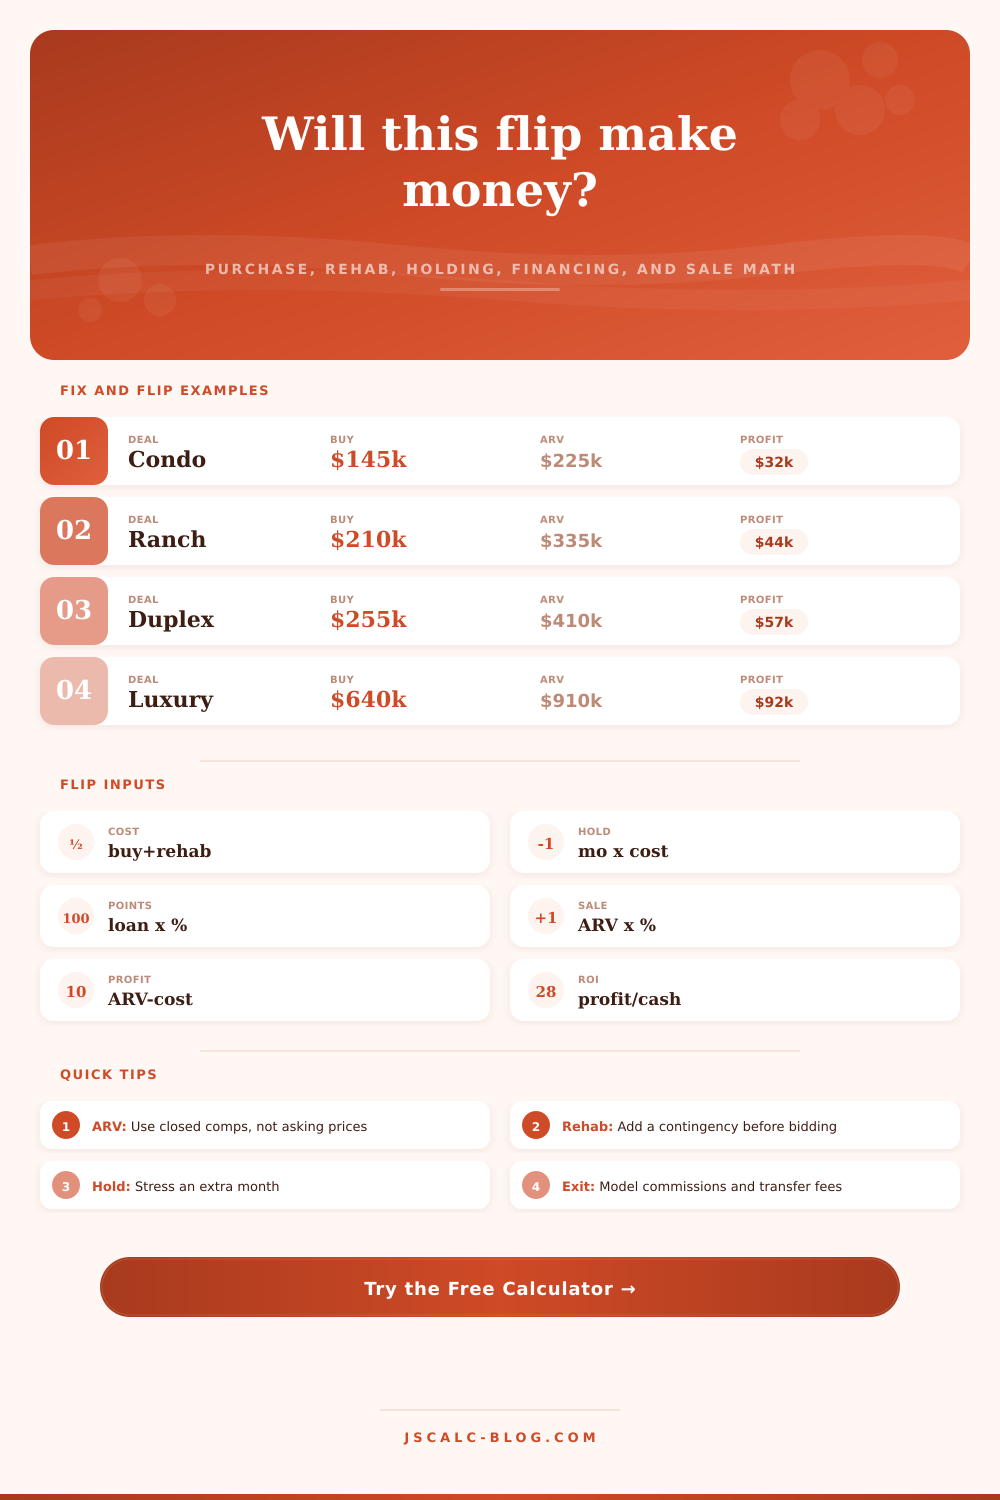
The majority of new investor focus on the after repair value. They forget about what-if’s between buying and selling. For example, you find a distressed ranch with a $210,000 asking price. After updating cosmetics, you believe it will sell for three hundred thirty-five thousand. Looks great on paper.
But in reality, do those numbers stand up to real-world conditions? Before you make an offer, run all the factors through a thorough profit calculator. Your deal’s outcome depend on the inputs you select.
Why You Must Check All Costs Before Buying a House
Begin with your base rehab estimate and your purchase price. Don’t end there! You’ll need to tack on a contingency for unknowns: cracked foundations, outdated wiring… problems revealed once you take down that drywall. Ten percent added to your rehab budget isn’t pessimistic, it’s an insurance policy against losing equity.
This calculator do the math for you. You won’t make mental math errors when negotiating. Deals fall through all the time due to time. People do not understand how much time is worth when it come to financing. Hard money loans charges upfront points and a very high rate of interest. Each month that you have house, you’re paying your hard money lender.
That’s why if something take longer than expected (i.e. Things like scheduling conflicts or getting permits cause holding costs to add up in a hurry. Include your loan payment for each month, plus any utility bills, insurance and taxes while home sits empty. What looked like a 5-month project suddenly becomes a 7-month project (a two-month change can wipe out $10),000 of profits.
The other risk is selling costs. Closing fees, transfer taxes and agent commissions usualy add up to about seven percent of the sale price. That’s a big chunk of money, and unless you factor this into your math upfront, it greatly reduces your margin when you put house on the market.
Here are some examples of how a rehab overrun (or lower sale price) impacts your bottom line: Simple ROI isn’t the clearest way to look at return on investment; you also need to consider time efficiency, namely the annualized return on investment. A twenty percent return over twelve months looks impressive until you compare it to a thirty-five percent return achieved in six months, that’s much better! Annualization lets us see which deal earned us more cash per year, forcing us to focus on both scope and speed: we don’t want to pick a low-margin project that locks away our money for too many years.
Not every great flip are the most profitable flip. Sometimes the greatest flippers are the ones that has the least chance to fail. Before you make an offer, consider running several scenario. What would happen if contractor bids came in 15% over budget? How about if market softened by three percent? Is the deal still profitable assuming worst case scenario?
If yes, then maybe you’re onto something. But if margins vanish even at the slightest hint of trouble, then walk away. There’s always going to be another house. And remember, you’re trying to build wealth and protect your capital. This isn’t a game of roulette where you bet on blind hopes. When you look at numbers, they’ll speak for themselves. So should your expectations.