Effective Property Tax Rate Calculator
Find your true effective property tax rate by dividing the annual tax bill by the home's fair market value, then compare it against the nominal assessed rate, the equivalent mills, your monthly cost, and representative state and national averages so you know whether your bill is high or fair.
🏠Real Property Tax Scenarios
📝Property and Tax Inputs
Total yearly property tax from your bill or escrow statement.
What the home would sell for today. Drives the effective rate.
Taxable value on your notice. Used for the nominal rate and ratio.
Sets the reference rate for the vs benchmark card.
A second home's annual tax to compare side by side. 0 to skip.
Market value of the second property for its effective rate.
Value removed before nominal rate is applied to assessed value.
Controls rounding on the percentage result cards.
🔢Formula Snapshot
📋Effective Rate Definition Examples
| Annual Tax | Market Value | Effective Rate | Reads As |
|---|---|---|---|
| $3,000 | $300,000 | 1.00% | US average |
| $4,400 | $200,000 | 2.20% | High tax |
| $2,400 | $150,000 | 1.60% | Above average |
| $1,000 | $333,000 | 0.30% | Very low |
| $6,300 | $300,000 | 2.10% | Illinois-like |
| $3,200 | $400,000 | 0.80% | Below average |
| $7,000 | $350,000 | 2.00% | Two percent |
| $1,750 | $250,000 | 0.70% | Low tax |
📍Representative State Effective Rates
| State | Effective Rate | Tax per $1000 | On $300k Home | vs National |
|---|---|---|---|---|
| New Jersey | 2.20% | $22.00 | $6,600 | +1.20% |
| Illinois | 2.10% | $21.00 | $6,300 | +1.10% |
| Connecticut | 1.90% | $19.00 | $5,700 | +0.90% |
| Texas | 1.60% | $16.00 | $4,800 | +0.60% |
| National Avg | 1.00% | $10.00 | $3,000 | 0.00% |
| California | 0.72% | $7.20 | $2,160 | -0.28% |
| South Carolina | 0.55% | $5.50 | $1,650 | -0.45% |
| Hawaii | 0.30% | $3.00 | $900 | -0.70% |
🗃Effective vs Nominal Comparison Grid
| Scenario | Annual Tax | Market Value | Assessed Value | Effective Rate | Nominal Rate | Assess Ratio |
|---|---|---|---|---|---|---|
| Full market assessment | $3,000 | $300,000 | $300,000 | 1.00% | 1.00% | 100% |
| Assessed at 90% | $3,000 | $300,000 | $270,000 | 1.00% | 1.11% | 90% |
| NJ high tax town | $6,600 | $300,000 | $300,000 | 2.20% | 2.20% | 100% |
| Illinois suburb | $6,300 | $300,000 | $100,000 | 2.10% | 6.30% | 33% |
| California Prop 13 | $2,160 | $300,000 | $180,000 | 0.72% | 1.20% | 60% |
| Texas homestead | $4,800 | $300,000 | $275,000 | 1.60% | 1.75% | 92% |
| Hawaii low rate | $900 | $300,000 | $300,000 | 0.30% | 0.30% | 100% |
| Over-assessed home | $5,000 | $250,000 | $300,000 | 2.00% | 1.67% | 120% |
| Starter home | $2,400 | $150,000 | $140,000 | 1.60% | 1.71% | 93% |
| Luxury estate | $9,000 | $900,000 | $810,000 | 1.00% | 1.11% | 90% |
📏Rate, Mills, and Cost Conversions
| Effective Rate | Equivalent Mills | Tax per $1000 | Monthly on $300k |
|---|---|---|---|
| 0.30% | 3.0 mills | $3.00 | $75 |
| 0.50% | 5.0 mills | $5.00 | $125 |
| 0.75% | 7.5 mills | $7.50 | $188 |
| 1.00% | 10.0 mills | $10.00 | $250 |
| 1.50% | 15.0 mills | $15.00 | $375 |
| 2.00% | 20.0 mills | $20.00 | $500 |
| 2.20% | 22.0 mills | $22.00 | $550 |
⚙Formula Breakdown
💡Property Tax Insight Tips
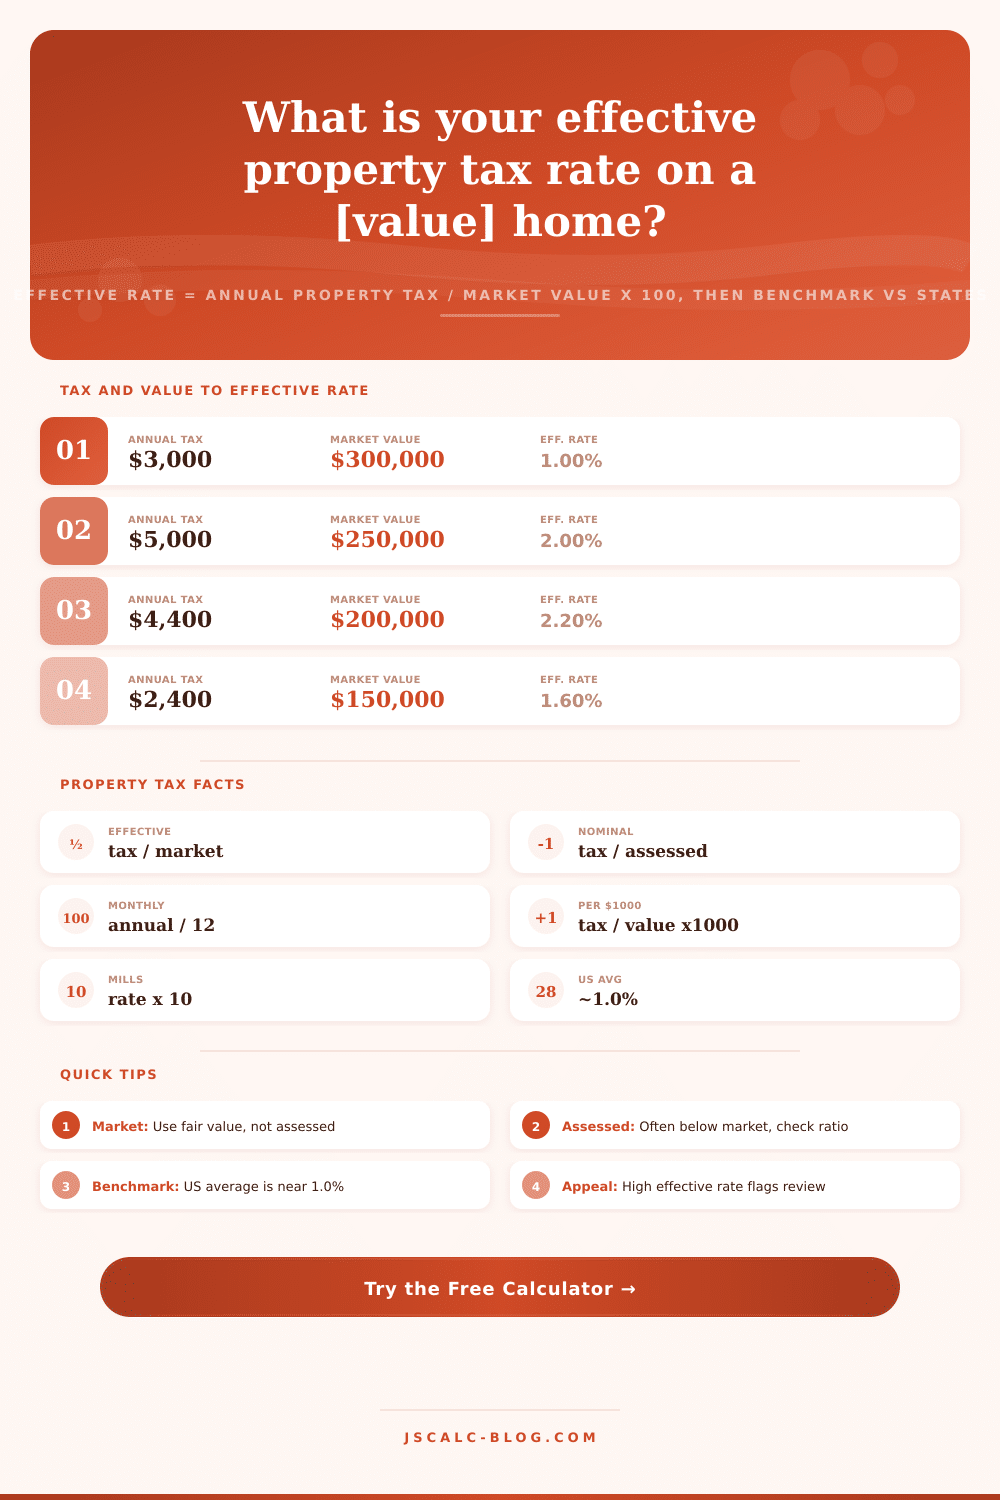
The Effective Property Tax Rate: How to Understand Your Property Taxes This article is via JSCalc-Blog.com. At some point or another, every homeowner wonders whether they’re overpaying their taxes. When it comes to property taxes, they can be quoted in all sorts of confusing formats. Sometimes as dollars per year; other times, as a percentage of the “assessed” value of your house (which rarely has anything to do with the actual price at which you bought or sold your house). The effective property tax rate clears away all of this confusion. This section explains what the effective rate tells you. Your property’s effective tax rate is calculated as the percentage of your home’s true market value that gets taxed per year. Here’s how they do it: annual tax ÷ market value x 100 To calculate yours, take the amount of money you paid in property taxes last year ($3,000) and divide it by your homes sale price (assuming it would’ve sold for $300,000). Then multiply it by 100. In this case, your effective rate is 1.00%. This means your effective rate is exactly at the national average. Why does it matter? Because it lets you directly compare rates between different states, counties, and even towns. Without context, a dollar amount doesn’t tell you anything. And a mill rate won’t cut it, it’s based on an assessed value, which wildly differs depending on where you live. Confusion over these rates is what trips most homeowners up. The nominal (aka assessed) rate means the total annual tax amount, as a percentage of assessed value. On your assessment notice, it will print out the assessed value and how much that value is taxed for the year. The effective rate means the same thing, but with market value substituted for the assessed value. If these values aren’t equal (which they rarely are), then these two rates will not be equal in practice. They’re almost always different, because lots of jurisdictions assess homes at a fraction of their market value. For example, the assessment ratio could be 60% or 90%. Some jurisdictions reassess very slowly; for instance, if you bought a long-held home in California under Proposition 13, it’s likely that it has an assessed value well-below its current market price. The calculator displays both rates side-by-side. And it calculates the assessment ratio so you can see exactly where they differ from each other. These two rates diverge for several reasons. Let’s say you live in an Illinois suburb with a home worth $300,000 which is assessed for only $100,000 (but which is taxed for $6,300 per year). At first glance, the 6.30% tax rate seems high. It’s a steep nominal rate on the assessed value. But it’s actualy only a 2.10% effective rate on the actual market value. And vice versa: You might live in a county which assesses your home at $300,000, but you know it would only fetch $250,000 on the open market. In this case, your assessment ratio is greater than 100%, and that’s a warning sign. It means you’re probably being over-assessed; you’re contributing to your community more than your fair share. Reading the nominal rate alone wouldn’t reveal any problem. The effective rate is our honest way to compare. Benchmarking Against State and National Averages Knowing the tax rate in a vacuum isn’t very meaningful. The calculator allows you to compare your effective rate with a reference rate, whatever you prefer: the national average, or that of any other state. The national average effective property tax rate is approximately 1.0%. On the high side, states such as Illinois run up near 2.1% and New Jersey near 2.2%. (Texas sits at about 1.6%, which is why it has no state income tax. Property taxes are its main source of revenue. On the low side, you’ll find Hawaii at about 0.3%. California and South Carolina are both significantly below-average. Inside the tool, there’s a reference table showing these typical rates along with the corresponding dollar amount paid for every $1,000 of home value. You’ll be able to see immediately where your rate falls within the national range. Mills, Monthly Cost, and Tax per $1,000 The calculator converts your rate into other terms you’ll see out there. For example, a “mill” represents one dollar of tax on every $1,000 of value, or 0.1%. (So 10 mills is an effective rate of 1.00%.) And the tax per $1,000 view shows the same rate in dollars. That’s convenient if you want to do some quick mental math. How much does the tax cost you each month? Most owners have their property tax included in their monthly mortgage escrow account. To display this cost, the tool takes the annual bill and divides it by twelve. If the annual bill is $3,000, then the monthly cost is $250. It’s a nicer fit in our household budgets compared to a lump sum that comes once or twice a year. To use this calculator, first enter the market value of your home and your annual property tax bill. Those two inputs generate the effective rate. Inputting your assessed value will show you the assessment ratio and the nominal rate. It will also enable other features. If you live in an area with a homestead exemption, input it here. Homestead exemptions decrease the taxable value prior to applying the nominal rate. Select a benchmark using the dropdown menu for comparison. Optionally, you can input a second set of tax and value information to put two homes head to head. There are ten presets which represent real-world scenarios, from a Proposition 13 California home to a high-tax town in New Jersey. All presets automatically fill out the fields and recalculate. Taking Action (and Reading the Results) Everything’s summarized for you in four result cards. These show your monthly cost, your nominal assessed rate, your effective rate, and how far above/below the benchmark your rate is. The breakdown panel shows each substituted number line by line. A plain-language verdict tells you if your rate is low, average, or high. If the tool flags an assessment ratio over 100%, treat it as a prompt to find comparable sales. In this case, consider appealing. Whether you’re challenging an assessment, weighing two towns, or simply budgeting for a purchase, the effective rate allows you to compare apples to apples. This calculator puts that number and all its supporting math in front of you within seconds. This article is via JSCalc-Blog.com. At some point or another, every homeowner wonders whether they’re overpaying their taxes. When it comes to property taxes, they can be quoted in all sorts of confusing formats, sometimes as dollars per year; other times, as a percentage of the “assessed” value of your house (which rarely has anything to do with the actual price at which you bought or sold your house). The effective property tax rate clears away all of this confusion. What does it mean? Simply stated: it’s the annual property tax divided by the fair market value of your home. Enter these two numbers into the calculator below and it will instantly spit out your effective property tax rate. It also provides the context that matters, such as its equivalent mills, the nominal assessed rate, how much it costs each month, and how your rate compares to both the national and state average. This section explains what the effective rate tells you. Your property’s effective tax rate is calculated as the percentage of your home’s true market value that gets taxed per year. Here’s how they do it: annual tax ÷ market value x 100 To calculate yours, take the amount of money you paid in property taxes last year ($3,000) and divide it by your homes sale price (assuming it would’ve sold for $300,000). Then multiply it by 100. In this case, your effective rate is 1.00%. This means your effective rate is exactly at the national average. Why does it matter? Because it lets you directly compare rates between different states, counties, and even towns. Without context, a dollar amount doesn’t tell you anything. And a mill rate won’t cut it. It’s based on an assessed value, which wildly differs depending on where you live. Confusion over these rates is what trips most homeowners up. The nominal (aka assessed) rate means the total annual tax amount, as a percentage of assessed value. On your assessment notice, it will print out the assessed value and how much that value is taxed for the year. The effective rate means the same thing, but with market value substituted for the assessed value. If these values aren’t equal (which they rarely are), then these two rates will not be equal in practice. They’re almost always different, because lots of jurisdictions assess homes at a fraction of their market value. For example, the assessment ratio could be 60% or 90%. Some jurisdictions reassess very slowly (for instance), if you bought a long-held home in California under Proposition 13, it’s likely that it has an assessed value well-below its current market price. The calculator displays both rates side-by-side. And it calculates the assessment ratio so you can see exactly where they differ from each other. These two rates diverge for several reasons. Let’s say you live in an Illinois suburb with a home worth $300,000 which is assessed for only $100,000 (but which is taxed for $6,300 per year). At first glance, the 6.30% tax rate seems high, it’s a steep nominal rate on the assessed value. But it’s actualy only a 2.10% effective rate on the actual market value. And vice versa: You might live in a county which assesses your home at $300,000, but you know it would only fetch $250,000 on the open market. In this case, your assessment ratio is greater than 100%, and that’s a warning sign. It means you’re probably being over-assessed; you’re contributing to your community more than your fair share. Reading the nominal rate alone wouldn’t reveal any problem. The effective rate is our honest way to compare. Benchmarking Against State and National Averages Knowing the tax rate in a vacuum isn’t very meaningful. The calculator allows you to compare your effective rate with a reference rate, whatever you prefer: the national average, or that of any other state. The national average effective property tax rate is approximately 1.0%. On the high side, states such as Illinois run up near 2.1% and New Jersey near 2.2%. (Texas sits at about 1.6%, which is why it has no state income tax. Property taxes are its main source of revenue. On the low side, you’ll find Hawaii at about 0.3%. California and South Carolina are both significantly below-average. Inside the tool, there’s a reference table showing these typical rates along with the corresponding dollar amount paid for every $1,000 of home value. You’ll be able to see immediately where your rate falls within the national range. Mills, Monthly Cost, and Tax per $1,000 The calculator converts your rate into other terms you’ll see out there. For example, a “mill” represents one dollar of tax on every $1,000 of value, or 0.1%. (So 10 mills is an effective rate of 1.00%.) And the tax per $1,000 view shows the same rate in dollars. That’s convenient if you want to do some quick mental math. How much does the tax cost you each month? Most owners have their property tax included in their monthly mortgage escrow account. To display this cost, the tool takes the annual bill and divides it by twelve. If the annual bill is $3,000, then the monthly cost is $250. It’s a nicer fit in our household budgets compared to a lump sum that comes once or twice a year. To use this calculator, first enter the market value of your home and your annual property tax bill. Those two inputs generate the effective rate. Inputting your assessed value will show you the assessment ratio and the nominal rate. It will also enable other features. If you live in an area with a homestead exemption, input it here. Homestead exemptions decrease the taxable value prior to applying the nominal rate. Select a benchmark using the dropdown menu for comparison. Optionally, you can input a second set of tax and value information to put two homes head to head. There are ten presets which represent real-world scenarios, from a Proposition 13 California home to a high-tax town in New Jersey. All presets automatically fill out the fields and recalculate. Taking Action (and Reading the Results) Everything’s summarized for you in four result cards. These show your monthly cost, your nominal assessed rate, your effective rate, and how far above/below the benchmark your rate is. The breakdown panel shows each substituted number line by line. A plain-language verdict tells you if your rate is low, average, or high. If the tool flags an assessment ratio over 100%, treat it as a prompt to find comparable sales. In this case, consider appealing. Whether you’re challenging an assessment, weighing two towns, or simply budgeting for a purchase, the effective rate allows you to compare apples to apples. This calculator puts that number and all its supporting math in front of you within seconds.