EBIT Calculator
Calculate earnings before interest and taxes from net income, or from revenue minus COGS and operating expenses, then review EBIT margin, operating cost ratio, and reconciliation detail.
🎯Business Scenario Presets
🧮EBIT Inputs
Choose the statement view you trust most, or compare both for a data check.
Used for the comparison card and quick benchmark grid.
Use net sales or operating revenue before COGS and operating expenses.
Direct costs tied to products sold or services delivered.
Selling, general, administrative, R&D, payroll, rent, and similar operating costs.
Profit after interest expense, taxes, and other below-operating items.
Debt interest added back in the standard EBIT formula.
Income tax expense added back to move from net income to EBIT.
Calculation Breakdown
📌Current Scenario Grid
📘EBIT Margin Benchmarks
| Business Profile | Typical EBIT Margin Range | Cost Structure Signal | Common Watch Item |
|---|---|---|---|
| Manufacturing | 6% to 15% | COGS heavy, plant leverage matters | Gross margin compression |
| Software and SaaS | 10% to 30%+ | Low COGS, high R&D and sales spend | Sales efficiency and retention |
| Retail and ecommerce | 3% to 10% | Inventory margin and fulfillment driven | Shrink, markdowns, freight |
| Restaurants and food service | 4% to 12% | Food, labor, occupancy mix | Prime costs above plan |
| Transportation and logistics | 5% to 14% | Fuel, maintenance, labor utilization | Empty miles and downtime |
| Healthcare services | 7% to 18% | Clinical labor and reimbursement driven | Payer mix and staffing ratios |
| Professional services | 12% to 28% | Labor utilization and pricing power | Billable utilization |
| Hospitality and lodging | 8% to 22% | Occupancy, ADR, fixed-property leverage | Occupancy and labor schedules |
🗂Income Statement Mapping
| Line Item | Use In EBIT? | Calculator Field | Reason |
|---|---|---|---|
| Revenue or net sales | Yes | Revenue | Top line for EBIT margin and revenue method |
| COGS or direct costs | Subtract | COGS | Direct cost needed to reach gross profit |
| SG&A, R&D, payroll, rent | Subtract | Operating expenses | Operating costs deducted before EBIT |
| Interest expense | Add back | Interest expense | EBIT is before financing costs |
| Income taxes | Add back | Income taxes | EBIT is before tax expense |
| Net income | Starting point | Net income | Bottom-line route to EBIT |
| One-time below-operating gains | Review | Reconciliation gap | May explain why both methods differ |
📉Dynamic EBIT Sensitivity
| Scenario | Revenue Change | COGS Change | OpEx Change | Estimated EBIT | EBIT Margin |
|---|---|---|---|---|---|
| Base case | 0% | 0% | 0% | 0 | 0.00% |
📝Formula And Method Table
📊Preset Comparison Table
| Preset | Revenue | Revenue-Method EBIT | EBIT Margin | Why It Is Useful |
|---|---|---|---|---|
| Mature Manufacturer | 1,250,000 | 250,000 | 20.0% | Shows COGS-heavy operations with disciplined OpEx. |
| SaaS Scale-Up | 2,800,000 | 760,000 | 27.1% | Demonstrates low direct cost with large operating spend. |
| Retail Chain | 4,600,000 | 310,000 | 6.7% | Highlights thin-margin inventory businesses. |
| Restaurant Group | 1,900,000 | 165,000 | 8.7% | Useful for prime-cost and labor sensitivity. |
| Logistics Fleet | 3,250,000 | 325,000 | 10.0% | Connects fuel, maintenance, and route utilization. |
| Clinic Operator | 2,400,000 | 390,000 | 16.3% | Frames staffing and reimbursement pressure. |
| Agency Services | 980,000 | 215,000 | 21.9% | Shows labor leverage and utilization effects. |
| Hardware Startup | 740,000 | -120,000 | -16.2% | Captures early-stage operating losses. |
| Hotel Portfolio | 5,100,000 | 830,000 | 16.3% | Shows fixed-property leverage at scale. |
| Utility Provider | 8,800,000 | 1,850,000 | 21.0% | Models capital-intensive stable operations. |
💡EBIT Tips
EBIT stands for earnings before interest and taxes. When you build out your own spreadsheet, you’ll notice that different cell display different figures for operating profit. EBIT bridges that divide. By removing tax jurisdictions and financing decisions, EBIT reveals profitability of the underlying business. Why? Because whether you use debt or equity to fund a capital-intensive business like utilities shouldn’t factor into understanding your company’s performance. The marginal tax rate in the jurisdiction where those utility were purchased shouldn’t either. This is a cleaner gauge of operational performance.
Once you input your revenue breakdown (or an income statement), the tool above calculate it for you. You’ll have a solid figure for your bottom-line, before any deductions.
What Is EBIT and Why It Matters
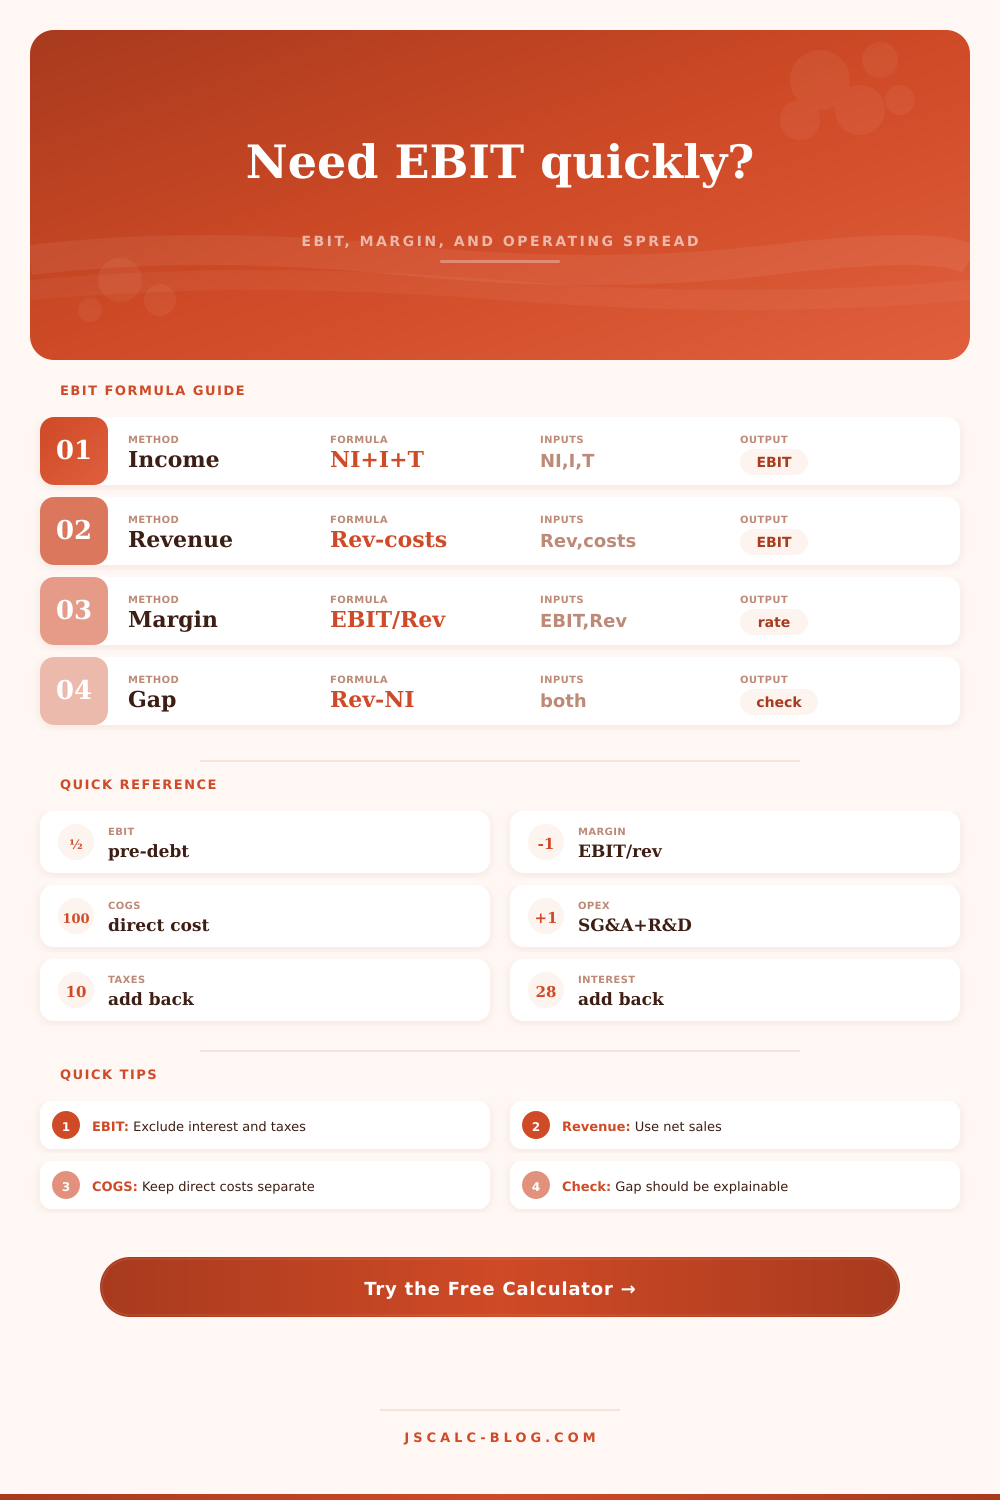
Everyone thinks they must pick either bottom-up or top-down. In fact, you should of be able to arrive at the same answer through both methods. The bottom-up approach begins with net income. Then add back taxes and interest. (This is simpler if you’re a mature company, have a clean balance sheet, or operate service firm.)
The top-down approach starts with revenue. Subtract operating expenses and cost of goods sold. This require you to look at your gross margin right away. For product and manufacturing business, it’s make-or-break.)
To try out both approaches, use our calculator. Compare the answers. When those figures differ, that gap is your hint. You probably forgot some off-the-books spending or one-time gain.
Knowing what feeds into those metrics matter more then feeding them in. Think of it as cost structure signs across industries. An operating expense ratio of 30% might look high, but it’s actualy normal for a SaaS business. You’re spending big dollars acquiring customers and on R&D. That’s fine. For a mature manufacturing business, it shouldn’t be. Their costs is more fixed. Their margins are thinner. The benchmark tables in the interface help contextualize this range of variation. It remind you that your EBIT margin isn’t really comparable to someone else’s who happens to run a restaurant chain. Stay within your industry profile to find something meaningful to compare based off.
This is where the rubber meets the road: the reconciliation gap. If the income-derived EBIT is different than the revenue-derived EBIT, that means there’s something “below the operating line” that needs a closer look. And no, it’s not necessarily taxes or interest. How about unusual legal settlements? Or perhaps there are gains on sales of old equipment? Or perhaps there are losses due to an unusual currency exchange? These all affect your view of recurring profitability, and the calculator will flag this gap for further investigation.
If you ignore the gap, you’re missing out on non-operating expenses. You don’t want your EBIT to be a reflection of accounting tricks and asset sales. You want it to represent cash flow generated by actual customers.
EBIT ≠ EBITDA, Don’t mix these up. EBITDA is earnings before interest, taxes, depreciation, and amortization. It’s helpful when companies are very capital intensive (e.g. These include hotels and utilities. In those cases, huge investments in assets distort the view.
Depreciation is a legitimate expense for most company. Your software licenses will expire. Your machines will wear out. That eats into your operating profit. EBIT reflects this fact. It requires you to account for the wear-and-tear of your assets before distributing profits.
Play with the sensitivity scenarios. These show what happens if revenue changes by 1% or if COGS rises or falls by X%. If your margins are narrow, a 2% decline in margin erases months of hard work. The math bites back, but it’s enlightening.
Operational health is measured by EBIT. Before you think taxes and financing, find out if the engine is running well. Use disciplined cost controls and watch out for that reconciliation gap. Compare yourself with the right peers. Use the calculator to get the numbers. Then use your judgment. Are they a problem? Or are they a thriving business?