EBITDA Calculator
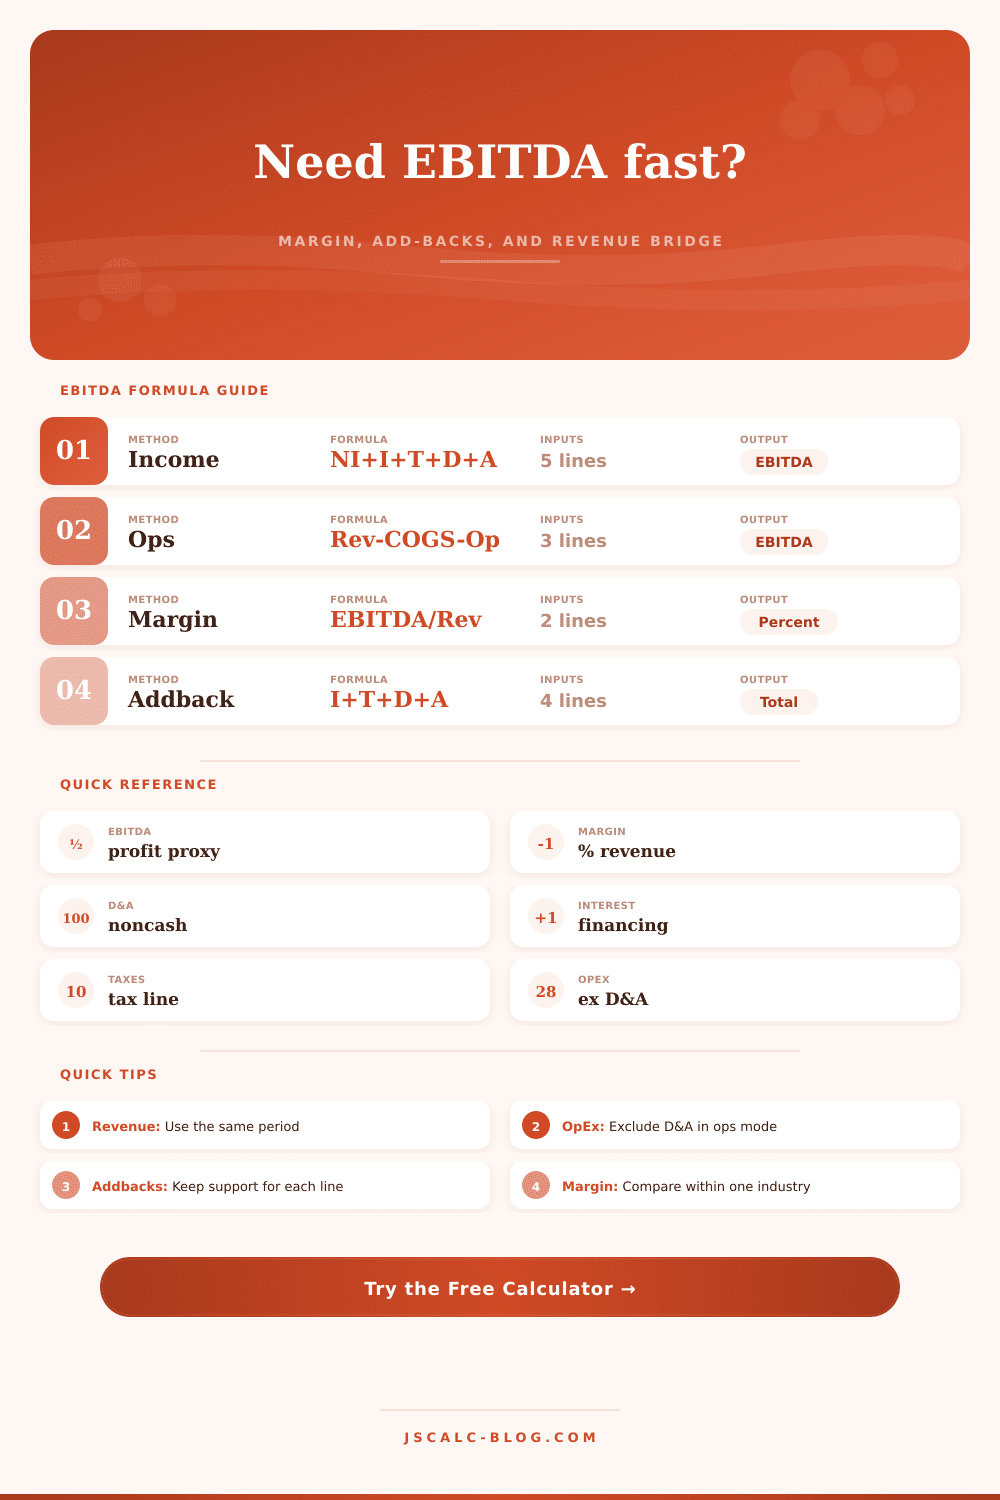
Calculate EBITDA from net income plus interest, taxes, depreciation, and amortization, or from revenue minus COGS and operating expenses that exclude D&A.
📌Business Scenario Presets
🧮EBITDA Inputs
Use compare mode to reconcile the two common EBITDA formulas.
Profile benchmarks are broad context, not valuation advice.
Enter month, quarter, TTM, fiscal year, or forecast period.
Controls money amounts, percentages, and bridge rows.
Use net revenue for the same period as the expense inputs.
Bottom-line profit after interest, taxes, depreciation, and amortization.
Enter positive expense; interest income can be entered as a negative amount.
Use tax expense from the same statement period.
Noncash charge for tangible assets.
Noncash charge for intangible assets.
Direct costs tied to products, services, or cost of revenue.
Exclude depreciation and amortization here to avoid subtracting them twice.
EBITDA Results
📊Current Profile Snapshot
📋EBITDA Bridge Table
| Line item | Amount | Revenue share | Formula role | Included method |
|---|---|---|---|---|
| Results load after calculation. | ||||
🔍Industry Context Table
| Profile | Typical margin focus | D&A pattern | Best cross-check | Watch item |
|---|---|---|---|---|
| Software or SaaS | Recurring revenue efficiency | Often low to moderate | ARR retention and cash burn | Capitalized software treatment |
| Manufacturing | Plant contribution | Moderate to high | Gross margin and utilization | Maintenance capex after EBITDA |
| Retail or ecommerce | Merchandise and fulfillment | Usually moderate | Contribution margin after delivery | Lease and platform costs |
| Professional services | Labor leverage | Usually low | Utilization and billable margin | Owner compensation adjustments |
| Healthcare services | Provider and clinic margin | Moderate | Payer mix and labor ratio | One-time reimbursement true-ups |
| Logistics or transport | Route and fleet productivity | High for owned fleet | Fuel, repair, and fleet capex | Asset-light versus owned assets |
| Hospitality | Property operating profit | High for owned assets | Occupancy and RevPAR | Rent, franchise fees, and capex |
| Utility or infrastructure | Regulated operating base | Very high | Funds from operations | Debt load and replacement cycle |
📘Formula Breakdown
💡EBITDA Tips
Net Income On an income statement, bottom line is rarely the whole truth. It’s a well-constructed number, driven by tax strategies, financing decisions, and accounting rules. To get beyond that noise, investors and operators digs deeper into EBITDA: earnings before interest, taxes, depreciation, and amortization. This number removes the noise to show underlying operating profitability of your business.
Click here for our Calculator to do the math for you. However, what really drives better decisions is knowing what all these numbers mean.
Understanding EBITDA
There are two ways you could think about it: (1) You could begin with net income and then work backwards. Adding back taxes, interest, depreciation and amortization. That’s called the “add-back” method, which makes sense because all these line items is clearly laid out on financial statements.
(2) Alternatively, you could start with revenue and work forward, subtracting operating expenses plus cost of goods sold. Assuming that you’ve been careful to exclude depreciation and amortization from those expenses, this is the “operating” method, since it reflects what’s happening at an operating level.
These methods should of both arrive at same place. If they don’t, something are wrong with one of your inputs, and you’ll need to investigate. With the tool, you can toggle between these two methods or view them side-by-side to ensure they match.
It’s more important to understand what goes into it. Your revenue should match the time-frame your other expenses occurs within. Your net income should show bottom line after everything else comes off. Taxes and interest payments are your government and financing commitments, not operations-related ones; therefore, you want those removed.
Amortization and depreciation are a little sneaky, these is non-cash expenses. In other words, you’re decreasing your taxable earnings but you haven’t physically written any checks out of your bank account this month. That being said, they tell you something about how your business’ assets is deteriorating. If you don’t plan for upcoming big costs, it’s not wise to ignore them entirely.
The beauty of the calculator is that it allows you to see each piece on its own, helping you identify its contribution to the end result. To compare performance, you can use EBITDA margin as a standardized measure. This is just EBITDA over revenue.
An EBITDA margin of 20% in retail may be unusual whereas that margin for a software business would be average. Everything depends on context. To show what is normal, page’s reference table includes common expense patterns and margin focuses for various industries.
Software businesses are focused on retaining customers and operating efficient with their recurring revenues. Manufacturers is focused on gross margin and plant use. Logistics companies is focused on fleet management and route productivity.
There is no point in comparing EBITDA margins between different sectors. You need to compare apples to apples… Or at least close substitutes.
While EBITDA is often used as a proxy for cash flow, that’s where many folks goes wrong with this number. Inventory level changes, capital expenditures, and other working capital changes isn’t accounted for in EBITDA. If they are investing heavily in inventory, or otherwise tying up lots of capital in accounts receivable, an EBITDA-rich business could be burning through cash. EBITDA is an operational profitability metric, not one of liquidity. That should inform how you make investment decisions or value a company using this metric.
To find the add-backs, EBITDA simply adds together depreciation, amortization, interest, and taxes. You’ll get a sense from this number of how much your profits are getting absorbed by your obligations to the government (taxes), your borrowing costs (interest) and writedowns on assets (depreciation/amortization). The calculator’s presets help you get a feel for what’s realistic.
A regional manufacturer will depreciate differently than a services company. The services company could have higher wages and lower depreciation. The manufacturer could have many assets, which means they need maintenance and therefore higher depreciation.
The “reconciliation gap” results feature is invaluable. When the EBITDA you calculate from your operating method doesn’t match your income method, this gap shows where the difference is. This forces you to check your operating expenses and make sure you haven’t double-depreciated.
In short, EBITDA is a lens (but not everything). It boils complicated financial statements down to one metric to shine a light on operating efficiency. It eliminates the noise from tax regimes and capital structures. At the same time, it wipes away the real-world difficulties of working capital needs and assets replacement. To know the business, you must go beyond the number.
The arithmetic comes through the calculator; now you’re free to analyze. It turns raw data into meaningful insights, if you keep in mind the limitations of this metric. Peel back the accounting layers and you’re closer to the economic reality of the business.
That’s why EBITDA is so powerful. Despite its imperfections.