Contribution Margin Calculator
Calculate total contribution margin, contribution margin ratio, break-even units, and the units needed to hit a target profit.
Used for the benchmark grid and interpretation only.
Choose whether you know total variable cost or unit cost.
Net sales for the period before fixed costs.
Orders, seats, customers, subscriptions, or items.
Costs that rise with sales volume.
Used when variable cost mode is per-unit.
Rent, payroll, software, insurance, and overhead.
Profit goal after covering fixed costs.
Optional operating plan compared with break-even.
| Business model | Common unit | Variable costs to include | Fixed costs to keep separate | CM ratio signal |
|---|---|---|---|---|
| Retail product | Item sold | COGS, packaging, merchant fee | Rent, base payroll, platform tools | 40% to 60% is often healthy |
| Food or beverage | Meal, drink, order | Ingredients, disposable packaging | Lease, salaried labor, equipment | Ingredient-heavy sales need volume |
| SaaS subscription | Account or seat | Hosting, payment fees, support load | Engineering, admin, core software | High ratio supports scaling |
| Service business | Client, job, hour | Contractor labor, job materials | Management salary, office, tools | Labor utilization drives margin |
| Digital product | Sale or license | Platform fees, support, fulfillment | Content creation, software, admin | Often high after creation costs |
| Manufacturing run | Finished unit | Materials, direct labor, freight | Facility, supervisors, insurance | Yield and scrap affect CM fast |
| Classes or events | Seat booked | Instructor split, materials, fees | Studio lease, scheduling software | Capacity sets the ceiling |
| Subscription box | Box shipped | Products, pick-pack, postage | Warehouse, systems, salaried team | Shipping sensitivity is high |
| Sales | Variable costs | Contribution margin | CM ratio | Meaning |
|---|---|---|---|---|
| $10,000 | $7,000 | $3,000 | 30% | $0.30 of each sales dollar covers fixed costs and profit |
| $10,000 | $6,000 | $4,000 | 40% | Break-even needs fewer sales than a 30% ratio |
| $10,000 | $5,000 | $5,000 | 50% | Half of each sales dollar contributes after variable costs |
| $10,000 | $3,500 | $6,500 | 65% | Higher contribution can absorb more fixed overhead |
| $10,000 | $2,000 | $8,000 | 80% | Common for scalable digital or subscription offers |
| $10,000 | $1,000 | $9,000 | 90% | Very high ratio, but fixed costs may still be large |
For example, you can make a lot of money and watch your business fail. Why? Owners is focused on dollars sold (total sales) rather then dollars over variable cost (the gap between those two figures).
The difference, contribution margin, are what tells you if a new sale contribute to the business or simply shuffles money from one pocket into another. Entrepreneurs view profit as end-goal. In fact, profit depend on how much cash each unit makes beyond its own cost.
Understanding Your Business Costs and Profits
That’s why we created a calculator for you to plug in your information and let it do the math for you while you interpret result. You put in how many units you sell; you put in the price you charge per unit; you put in what your variable cost is (which includes things like advertising and delivery).
This will strip away all that stuff that doesn’t matter to show economic engine that drives this business. Your inputs matter more then your outputs: Bad input equals bad decision.
Don’t put your rent as a variable cost; you’ll think your business are more profitable than it is. Don’t forget payment processing fees; you’ll think your business is more efficient than it is.
What is realy variable vs. Fixed? Your variable costs will change with the volume. The more you sell, the higher your direct materials, shipping costs, and credit card fees will be. Your fixed costs don’t vary. Whether you sell one item or a thousand, rent doesn’t varies. Salaries paid to salaried employee don’t vary.
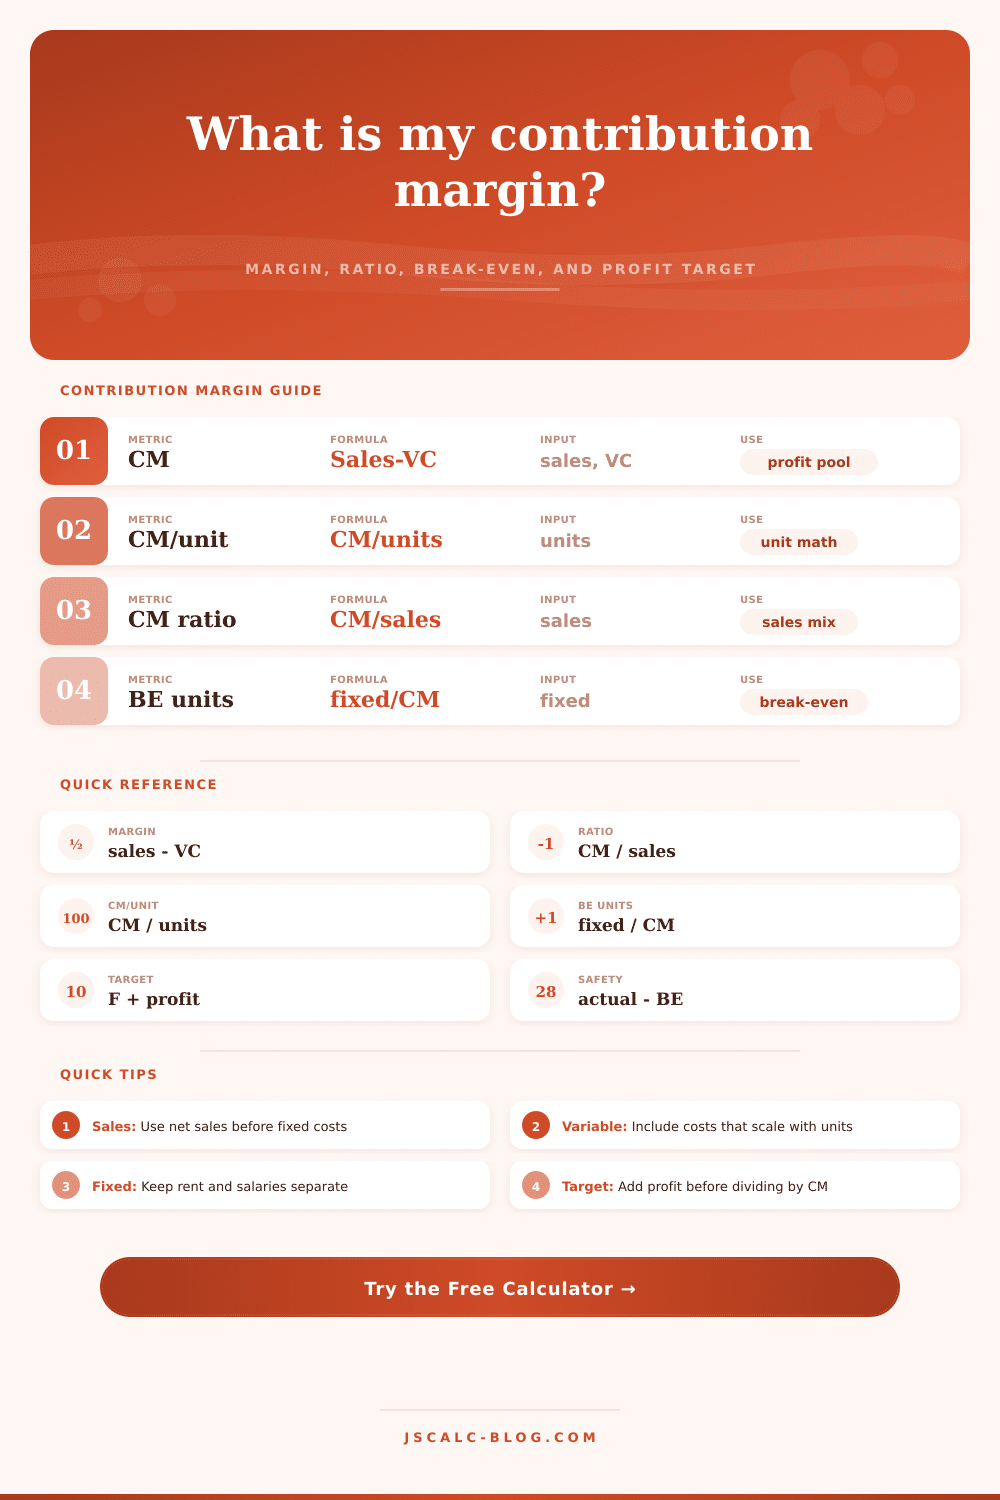
Contribution margin ratio: this indicate what percent of each dollar of sales is available to offset your fixed costs. If it’s high, it’s got a nice cushion. If it’s low, its a shaky business.
Volume is dangerous for low-margin businesses. They requires huge amounts of sales just to keep their heads above water. This is explained in the reference table on the page for various business models.
If your variable cost is low, then your ratio should of be high (SaaS companies rely heavily on that). If your cost for hosting and support scales slowly, then your ratio will be high. If most of your revenue go toward packaging and ingredients, then your margin is going to be thin.
You’re a food truck, you live off volume and speed. Your ratio isn’t very good. Understand your category and how it affect how you operate.
If your ratio is wide, don’t get complacent; you can’t afford it. If your ratio is tight, you can’t price yourself into the market. The math doesn’t give a shit what you feel about the market.
Theory meets practice in break-even analysis. How many units do you need to sell before no longer losing cash? That’s a precise number, and the calculator reveal it.
Achieving it won’t make you rich. You’ll be even. Anything beyond that contribute purely to profit.
This is why target profit planning works. This work because you’re working backwards from the amount of cash required to a certain level of sales. A hazy aspiration becomes a daily quota. You have an exact number of units to sell in order to reach your goal.
People often overlook that safety margin, the difference between your break-even point and where you are today. That’s your safety margin, protection against a bad month.
When you has a small safety margin, even a small drop in traffic lead to losses. It has an outsized effect. To increase your safety margin, you need to either increase your contribution margin or lower your fixed costs.
You can lower your variable costs (but at the expense of quality). You can raise prices (but at the risk of losing some customer). There’s no such thing as a free lunch in unit economics.
But the tool’s presets help anchor abstractions into reality. Software subscriptions are not like coffee carts. They look different than. The units is different. The cost structure varies. But the math is the same.
Contribution = sales (variable costs). Contribution cover fixed costs. Profit is what’s left over. It’s a simple pyramid. And it’s the lack of good tracking that makes things complicated.
Once you know the numbers, you don’t have to guess anymore. Instead, you can manage. Not only do you want to calculate the margin, but you want to guard it.
The bottom line is that not every sale actualy helps you grow; sometimes it just moves money from one pocket to another. The stronger your margin, the more the sale matter. The weaker your margin, the less your sale matters.
Are you playing a value game? Or are you playing a volume game? The calculator provides clarity. It turns the confusion of operations into a clear path. Once you identify the gap, you begin to widen it. That’s how you build a sustainable business.