Operating Margin Calculator
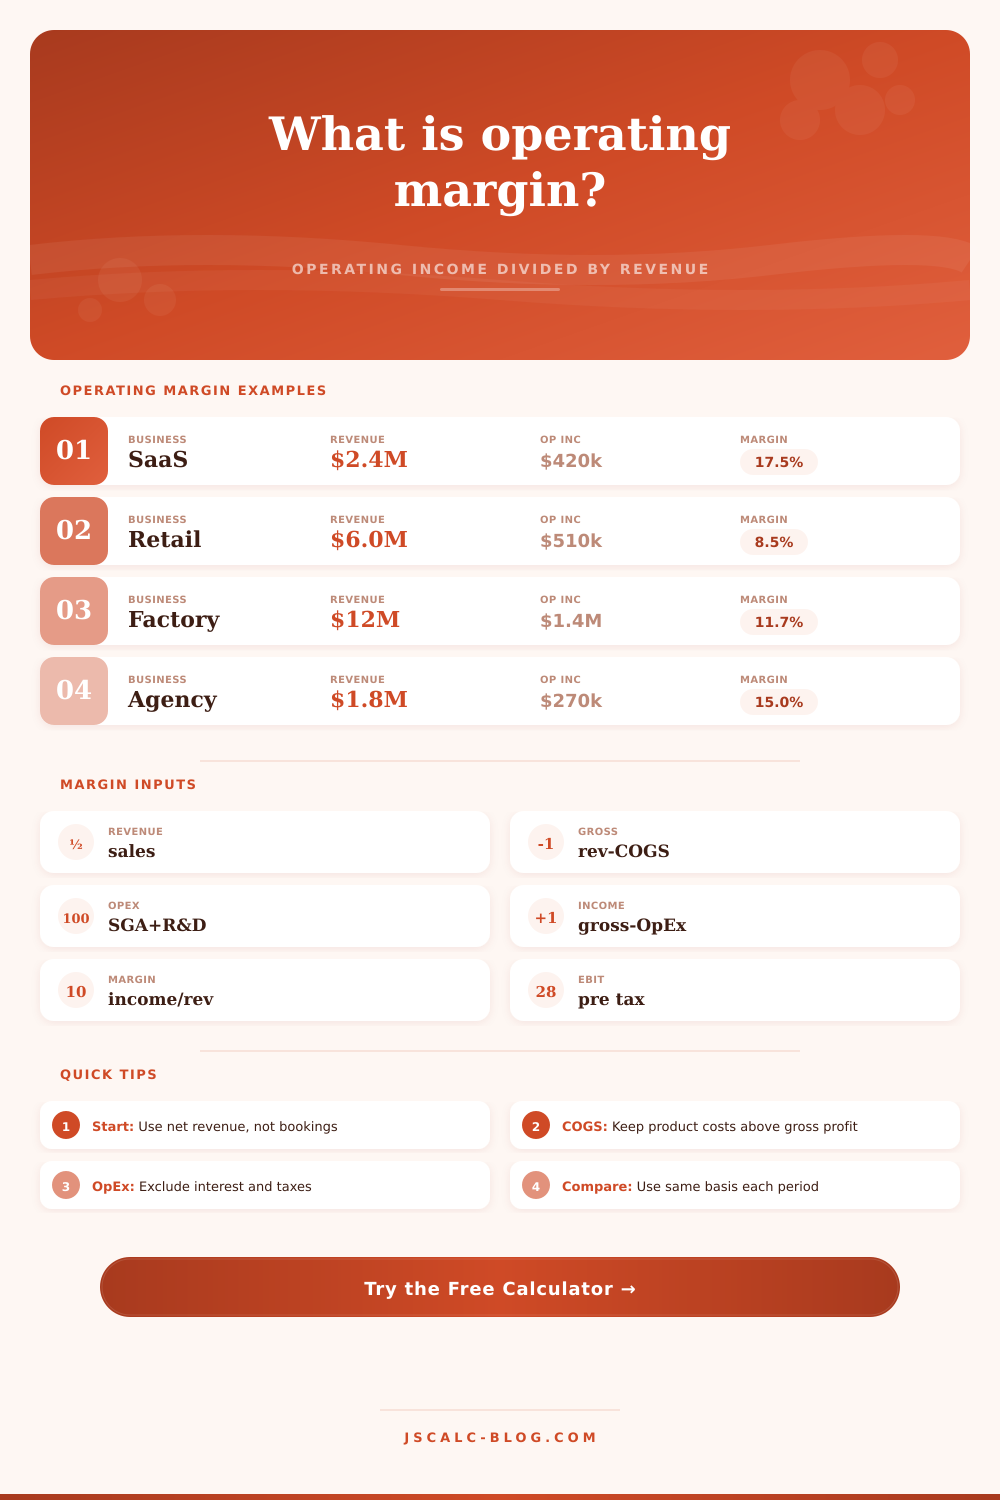
Calculate operating margin from revenue, gross profit, and operating expenses, then compare the standard operating income method with an EBIT margin variant for management reporting.
🎯Business Presets
📝Operating Margin Inputs
Standard margin uses operating income. EBIT margin adds non-operating reconciliation fields.
The benchmark note changes by profile; the formula remains the same.
Use net sales or GAAP revenue, not gross bookings or cash collected.
Product cost, hosting cost, fulfillment labor, or direct service delivery cost.
Sales, marketing, R&D, G&A, labor, admin, rent, and other recurring OpEx.
Include here when reported inside operating expenses.
Use positive for income and negative for expense when bridging to EBIT.
Used to show the income gap and revenue needed at the current cost structure.
Calculation Breakdown
🧭Margin Quality Grid
🧮Operating Margin Formula Table
| Metric | Formula | What it includes | What it excludes | Use in calculator |
|---|---|---|---|---|
| Gross profit | Revenue - COGS | Sales after direct costs | Sales, G&A, interest, tax | Intermediate result |
| Operating income | Gross profit - operating expenses | Core business profit before financing | Interest and taxes | Card 2 |
| Operating margin | Operating income / revenue x 100 | Profitability of operations | Capital structure effects | Card 1 |
| EBIT margin | EBIT / revenue x 100 | Earnings before interest and taxes | Interest and income tax | Variant comparison |
📊Business Profile Benchmark Table
| Profile | Typical operating margin range | Gross margin pressure | OpEx pressure | Best comparison base | Watch first |
|---|---|---|---|---|---|
| SaaS or software | 10% to 30% mature; lower in growth mode | Hosting and support | Sales, R&D, G&A | ARR revenue cohort | Sales efficiency |
| Marketplace or platform | 5% to 25% | Take rate and support | Marketing and trust operations | Net revenue, not GMV | Incentives |
| Ecommerce or DTC brand | 3% to 15% | Product, freight, returns | Ads, fulfillment, overhead | Net sales after returns | Contribution margin |
| Retail chain | 3% to 12% | Merchandise cost | Rent, labor, shrink | Comparable store sales | Store labor |
| Manufacturing | 6% to 18% | Materials, labor, scrap | Plant overhead and SG&A | Standard cost period | Utilization |
| Restaurant or food service | 2% to 10% | Food and packaging | Labor, rent, utilities | Same-store sales | Prime cost |
| Professional services | 10% to 25% | Billable labor | Bench time and admin | Net service revenue | Utilization |
| Logistics or distribution | 4% to 12% | Freight, fuel, handling | Warehouse labor, systems | Gross revenue less pass-throughs | Route density |
📋Preset Comparison Table
| Preset | Profile | Revenue | Gross profit | Operating expenses | Operating income | Operating margin | EBIT margin |
|---|---|---|---|---|---|---|---|
| Run the calculator to fill preset comparisons. | |||||||
🔍Scenario Sensitivity Table
| Scenario | Revenue change | COGS change | OpEx change | Operating income | Operating margin |
|---|---|---|---|---|---|
| Run the calculator to fill scenarios. | |||||
⚙Formula Breakdown Reference
💡Operating Margin Tips
Revenue, on its own, doesn’t tell you much about whether a company is healthy. If two companies earns the same amount in sales, but one has a higher operating margin, that tells you why one is more profitable than the other.
Operating margin is the money you’re left with after you spend it on product and your everyday bills: servers, payroll, etc. It doesn’t include tax or financing costs, those aren’t factors in how efficient your operations are. That’s what operating margin measures. You’re seeing into the raw health of the business model.
How to Calculate and Use Operating Margin
Enter your operating expenses, cost of goods sold, and revenue. Revenue equals net sales. Gross bookings will inflate the figure and make your margins appear better then they truly are. The calculator handles the math once you plug in your revenue, cost of goods sold, and operating expenses. You don’t have to use spreadsheet programs that break if you edit any cell.
Expenses is trickier. These are the expenses that you need for the company to operate, no matter how much product you sell each day. Rent, salary, research and marketing falls in this bucket.
The temptation here is to reduce them so you improve your margin. Beware. Reducing research will increase this quarters results, but diminishes the product pipeline. Reducing sales reduces growth today (but increases cash), while reducing marketing increases future growth.
What do the numbers tell? You want to know how effectively you convert revenue to pre-tax profit. And finally, you can compare EBIT with standard operating income. Here’s where we get into earnings before interest and taxes, which offer another perspective on performance.
It links overall financials with more core operations. So if you have non-operating income (e.g., gain from asset sale), your operating margin remains unchanged but your EBIT shifts. That helps distinguish whether you’re gaining traction in your core business, versus relying on asset sales. This matters for long-term planning.
Different industries has different benchmarks. Put it all in context. Twenty percent margin is good for a manufacturing company. Might be mediocre for a software business.
As the reference table indicates, high growth companies typically give up margins for marketshare. They burn cash to acquire customers and hope unit economics will follow at scale. For mature businesses, margins are needed for dividends. Don’t compare financial statements of startups to those of large corporations, know where you sit.
This analysis becomes practical advice when you engage in scenario planning. What if it costs 5% more? How will that impact your profit? What revenue do you need to achieve your desired margin? Reverse engineering is awesome. It turns fluffy targets into specific actions (reduce shipping costs, raise prices). It makes everything clear. Instead of wishing you had higher margins, you build them into your design.
Look at shifts in your product mix. Your operating margin may go down even when everything else is going up because you swapped out high-margin services for lower-margin products. Management cuts costs and says the numbers look bad. They are missing the fact that this isn’t an operational problem, but a strategic one. You’ve changed what you sell. The decision is reflected in the math.
The number is a measure of operational efficiency, but knowing why the number shifted matters more. Margin management becomes your daily routine, running these numbers on a regular basis. You start recognizing what expenses can be tweaked and what won’t budge. It turns financial information into strategy.
A positive number isn’t enough. It’s about knowing why the number exists, and how to defend it if market changes. That’s where the rubber meets the road.