Debt Service Coverage Ratio Calculator
Analyze property NOI, annual debt service, lender target DSCR, and stressed operating scenarios for JSCalc-Blog.com readers.
The grid updates from the selected property type and gives context for the target DSCR you enter.
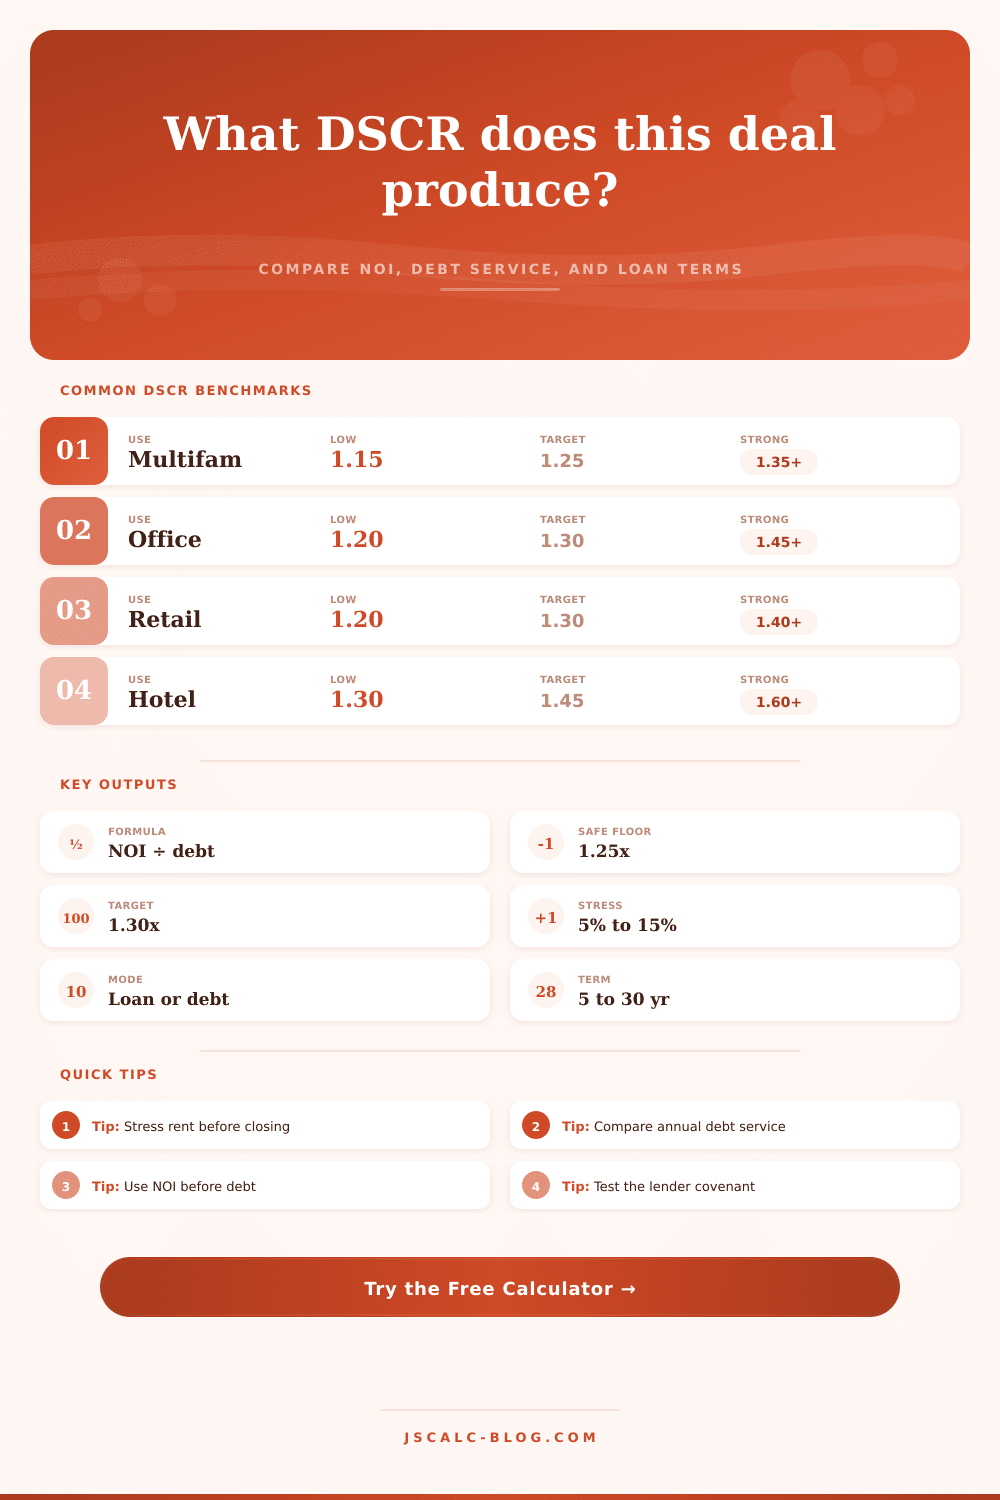
| Property type | Common minimum | Common target | Strong cushion | Typical stress focus |
|---|---|---|---|---|
| Multifamily | 1.15x | 1.25x | 1.35x+ | Vacancy and turnover |
| Retail | 1.20x | 1.30x | 1.40x+ | Tenant rollover |
| Industrial | 1.15x | 1.25x | 1.35x+ | Lease expiration |
| Office | 1.20x | 1.30x | 1.45x+ | Occupancy decline |
| Self storage | 1.20x | 1.30x | 1.45x+ | Rate concessions |
| Hotel | 1.30x | 1.45x | 1.60x+ | Seasonality |
| Student housing | 1.20x | 1.35x | 1.50x+ | Preleasing |
| Mixed use | 1.20x | 1.30x | 1.45x+ | Tenant mix |
| Input mode | Calculator uses | Annual debt service | Best for | Watch item |
|---|---|---|---|---|
| Annual debt service | Entered annual amount | As entered | Underwritten deals | Confirm reserves excluded |
| Monthly debt service | Entered monthly amount | Monthly × 12 | Current loan statements | Use principal plus interest |
| Loan amortizing | Loan, rate, term | Payment formula × 12 | New acquisitions | Match amortization term |
| Loan interest only | Loan and rate | Loan × rate | Bridge or IO periods | Test post-IO reset |
| Target DSCR | Lender covenant | Compared to NOI | Loan sizing | Use lender-required ratio |
| Stress case | Adjusted NOI | Same debt service | Downside review | Vacancy plus expenses |
| Scenario | Vacancy stress | Expense stress | Use when | Interpretation |
|---|---|---|---|---|
| Base lender case | 0% to 3% | 0% to 2% | Asset is stabilized | Tests normal operations |
| Moderate downside | 5% to 8% | 3% to 5% | Rents may soften | Checks covenant cushion |
| Lease rollover | 8% to 12% | 4% to 7% | Large tenants renew soon | Models income interruption |
| Rate reset review | 5% to 10% | 3% to 6% | Loan reprices soon | Pairs DSCR with new debt |
| High volatility | 12% to 18% | 6% to 10% | Hotel or short leases | Requires wider cushion |
| Workout screen | 15%+ | 8%+ | Cash flow is impaired | Shows default risk quickly |
| Rate | Term | Monthly payment per $1M | Annual debt per $1M | NOI for 1.25x |
|---|---|---|---|---|
| 5.50% | 25 years | $6,140 | $73,680 | $92,100 |
| 6.00% | 25 years | $6,443 | $77,316 | $96,645 |
| 6.50% | 25 years | $6,752 | $81,024 | $101,280 |
| 7.00% | 25 years | $7,068 | $84,816 | $106,020 |
| 6.50% | 30 years | $6,321 | $75,852 | $94,815 |
| 7.50% | 30 years | $6,992 | $83,904 | $104,880 |
The ratio is how most commercial real estate investors start: they find a promising-looking property (a strip center with good tenants, maybe, or a small multifamily building), run the numbers, and ask, “Does it pay?” That’s what the debt service coverage ratio answers. Does your income cover your debts? Are you able to pay your bills, or do you have to dip into your reserves?
The DSCR calculator does this math for you. But what do these numbers mean? Why not just divide? It’s simple math at its core. Take your net operating income and divide it by your yearly debt service. Anything above one point zero is considered to be technicaly covered.
Why DSCR Matters for Investors
But lenders don’t live in a world of technicality. Inevitably, reality isn’t going to align perfectly with the projections. An unanticipated repair could eat into margin. So could a sudden vacancy increase. That’s why most lenders look for a minimum of one point two five time coverage when issuing conventional loans. This gives them some breathing room when dealing with difficult nature of managing properties.
The inputs matter more than you think. Most folks take their gross income and simply deduct their most obvious expenses, but debt service and income taxes aren’t captured in net operating income (by definition). Including these items in your calculation skews the ratio and tricks you into thinking the asset is healthyer than it really is.
Also check whether you’re entering your debt costs correctly. To enter this item into the tool, you can choose between entering an annual amount directly or calculating it based off the details of your loans (e.g., interest rate and amortization term). A common mistake here is mixing up annual and monthly amounts for debts, which screws up all metrics downstream. Ensure you’re comparing annual income to annual principal + interest expenses.
So far so good. But the analysis become more useful with stress testing. Apply some stress factors to expenses and vacancy, and observe the ratio’s ability to withstand the pressure. For example, if you determine in your base case that you’ve got a nice healthy one point three five times coverage, but then you find that dropping vacancies by a modest five percent sends you below lender’s covenant, this signals a vulnerability. This isn’t “being negative,” it’s planning ahead. Tenants do default, leases do expire, and operating costs escalate. Pretending otherwise is merely fooling yourself.
On the page, there’s a handy reference table that outlines typical benchmarks across various asset class. Hotels are volatile enough that they demand greater coverage, whereas longer-term industrial leases frequently accommodate lower margins. The level of risk for various property types will impact your acceptance ratio: For example, a triple-net leased medical office building may have a lower acceptable ratio than a seasonal hotel located in a tourist town. Lenders understand that predictable cash flow justifies stricter debt levels; erratic income require a larger safety net.
It’s up to you (the investor) to align your assumptions regarding risk with the particular risks associated with the asset you’re underwriting. Don’t use the same vacancy rate for a single-tenant warehouse with a lease expiring in two years as you would for a diversified portfolio.
But it’s only a snapshot. This isn’t a crystal ball. It doesn’t tell you whether your management skills is good or bad. It doesn’t predict what the market will do over the coming years. It only tells you whether the math works, at this moment in time. That matters. Avoiding an expensive mistake is worth getting this basic test correct.
If the ratio is strong, you have some breathing room should something go wrong. If it’s weak, little problems turns into big crises. You want some wiggle-room so that even with a bad vacancy report, the numbers still make sense and can absorbs the debt.