Operating Expense Ratio Calculator
Calculate operating expense ratio, NOI, and NOI margin from effective gross income and annual property operating expenses. Debt service, capital expenditures, and depreciation stay outside operating expense.
🏢Property OER Presets
📝Annual Income and Operating Expense Inputs
Use rental income plus other income after vacancy and credit loss.
Enter the annual management fee as a dollar amount.
Use recurring operating reserves only; major replacements are capex.
Licenses, landscaping, pest control, trash, supplies, and similar recurring items.
📊Five-Column OER Snapshot
🧮Formula Reference Table
| Metric | Formula | Uses | Excluded items | Calculator output |
|---|---|---|---|---|
| Operating expense ratio | Operating expenses / EGI x 100 | Compares expense load to income | Debt service, capex, depreciation | Card 1 |
| Net operating income | EGI - operating expenses | Measures property income before financing | Loan payments and owner taxes | Card 2 |
| NOI margin | NOI / EGI x 100 | Shows income retained after OpEx | Capital replacements | Card 3 |
| Monthly NOI | Annual NOI / 12 | Turns annual NOI into a monthly view | Principal and interest | Snapshot grid |
📋Operating Expense Inclusion Table
| Line item | Included in OpEx? | Input style | Reason | Common review | Formula effect |
|---|---|---|---|---|---|
| Property taxes | Yes | Annual dollars | Recurring property-level charge | Reassessment risk | Raises OER, lowers NOI |
| Insurance | Yes | Annual dollars | Required recurring protection | Premium and deductible changes | Raises OER, lowers NOI |
| Repairs and maintenance | Yes | Annual dollars | Normal upkeep and turns | Deferred maintenance | Raises OER, lowers NOI |
| Management | Yes | Annual dollars | Operating service expense | Leasing and renewal add-ons | Raises OER, lowers NOI |
| Utilities, payroll, admin | Yes | Annual dollars | Recurring operating lines | Tenant reimbursements | Raises OER, lowers NOI |
| Debt service | No | Exclude | Financing decision, not property operations | DSCR after NOI | No OER effect |
| Capital expenditures | No | Exclude | Major replacements belong below NOI | Separate reserve schedule | No OER effect |
| Depreciation | No | Exclude | Non-cash accounting item | Tax reporting only | No OER effect |
🏘Property Type OER Benchmarks
| Property type | Typical OER range | Expense pressure | Margin check | Watch first |
|---|---|---|---|---|
| Single-family rental | 25% to 40% | Taxes, insurance, repairs | 60% to 75% NOI margin | Turnover and major systems |
| Townhome rental | 25% to 42% | HOA-style services, repairs | 58% to 75% NOI margin | Exterior responsibility split |
| Duplex or triplex | 30% to 45% | Vacancy exposure, utilities | 55% to 70% NOI margin | Owner-paid utilities |
| Fourplex | 32% to 48% | Management and maintenance | 52% to 68% NOI margin | Repairs per unit |
| Small apartment | 35% to 55% | Payroll, utilities, admin | 45% to 65% NOI margin | Labor and contract services |
| Student housing | 38% to 58% | Turnover, repairs, utilities | 42% to 62% NOI margin | Make-ready cycle |
| Mixed-use property | 35% to 55% | Commercial services and CAM | 45% to 65% NOI margin | Recoverable expenses |
| Small retail property | 25% to 50% | Taxes, insurance, common area | 50% to 75% NOI margin | Lease reimbursements |
| Office or flex property | 35% to 60% | Utilities, janitorial, repairs | 40% to 65% NOI margin | Service contracts |
📑Preset Comparison Table
| Preset | Type | EGI | Tax + insurance | Repairs + utilities | Payroll + admin | Total OpEx | NOI | OER |
|---|
🔍Expense Stress Table
| Scenario | Repairs change | Payroll change | Operating expenses | NOI | OER |
|---|
💡Practical OER Tips
Sure, you can assume that your investment property is producing X dollars in revenue… But then what about repairs? What about other expenses? The most helpful way to view reality is through a operating expense ratio (OER). This metric strips out financing information and allows you to see your building’s efficiency. Does it generate enough tenant cash flow to pay for upkeep … or do you pocket any profit?
It’s simple math, which is why we created this property expense calculator for you. All you do is plug in your yearly expenses and your effective gross income and it will crunch the numbers for you. Your ratio represent how much of your total income (minus vacancies) goes towards paying all your recurring operating expenses. A lower percentage means higher efficiency. A higher percentage mean the property is spending too much money on itself.
What Is an Operating Expense Ratio?
The tricky part are knowing what qualifies as an operating expense, differentiating here can make or break your metric. Capital expenditures vs. Repairs: Most investors conflate these two concepts. A repair sustains the building’s operation on an everyday basis (e.g., paint a unit; fix a leak). These gets charged to the operating expense pool, increasing your ratio. A capital improvement is a big-ticket replacement (e.g., HVAC system; new roof). It sits beneath the line of net operating income.
Muddle the distinction and you’ll twist your perception of current cash flow. Charge capital spending to the operating expense pool, and the building appear less capable of day-to-day management then it actualy is. Hide repairs as capital, and you overstate your incomes.
You must include recurring costs in the equation. They includes property taxes and insurance. Also included are management fees; utilities paid for by owner (if any); wages for staff; office supplies and administration; etc. You can see which line items affects the ratio in the reference table.
Debt service is left out of the equation. A mortgage payment is a decision about how to finance the property. It’s not an operation cost. Two otherwise identical properties may have differing cash flow because of their loan structures. But if operated equally, they will has comparable operating expense ratios. By leaving out debt, you’re evaluating the property without the funding.
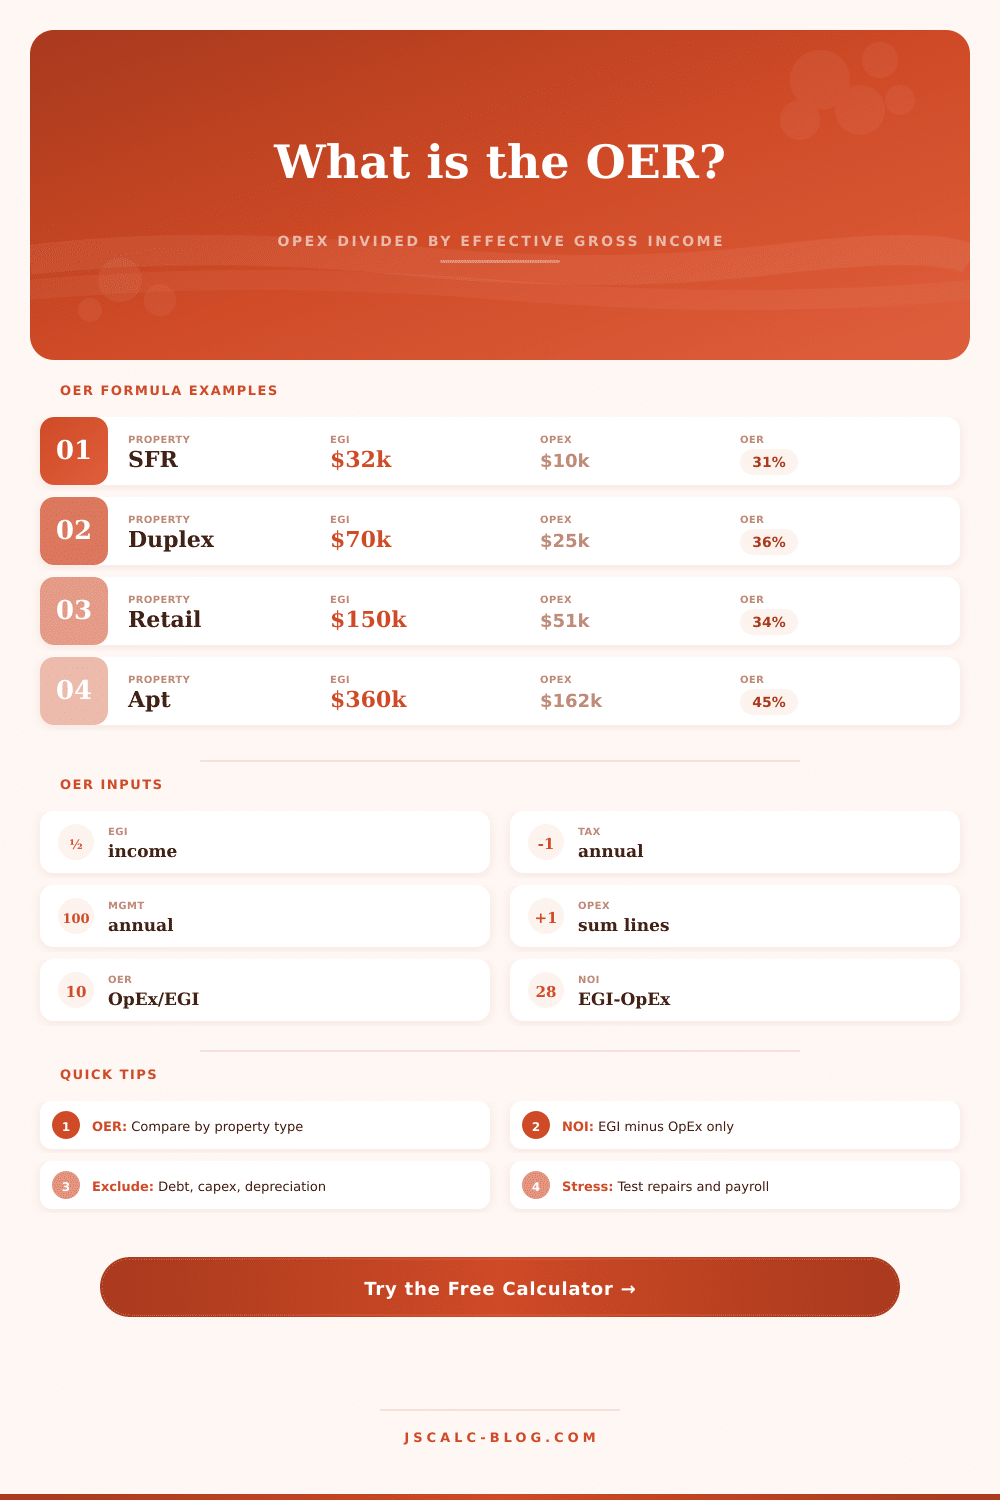
The point isn’t to compare properties on a raw number basis. Context is key. Generally speaking, single-family rentals are cheaper to operate compared to small apartment complexes. Operational cost ratios tend to fall between 25%, 40%. Because you’re dealing with only one unit, there’s far less shared infrastructure (e.g., a laundromat).
In contrast, small apartment buildings faces more maintenance requirements and higher tenant turnover. Their ratios is typically around 50% and up. That doesn’t mean they’re poor investments. It simply means they’re complex operations. A 45% ratio may indicate healthy performance at a dense urban multifamily property. However, it could also signal red flags at a suburban single-family residence.
Before purchasing, use this metric to test your assumptions. For example, if repair costs jump by 20% due to an aging roof or utility rates suddenly spike, what would of happened? How does it affect your net operating income? This shows you the safety margin of the deal. If something goes wrong, there’s hardly any wiggle-room for a property with very low profits.
I see investors all the time who fail to consider the total cost of operations and buy properties that are “profitable” on paper but actualy lose them money in real life. That’s not to say that every penny must be cut. There is some costs that maintain the property’s value and tenant satisfaction, leading to stable cash flow. But the point is to know your tradeoffs, the balance between cost vs. Quality.
Your operating expense ratio give you that insight. It transforms vague worries about overhead into an actual number that you can monitor and adjust long-term. When you can see your expenses, you’ll make better choices regarding repairs, replacement, and departures. This is the magic of focusing beyond top-line income.