Effective Gross Income Calculator
Calculate rental property EGI from gross potential rent, recurring income, vacancy loss, credit loss, concessions, and bad debt in monthly or annual mode.
🏠EGI Presets
📝Income and Loss Inputs
Use residential units, suites, rooms, pads, or other leasable spaces.
Gross potential rent uses units x monthly market rent x 12.
Applies to other income, laundry/parking, concessions, bad debt, and displayed main results.
Pet rent, storage, application fees, utility reimbursements, or recurring admin income.
Keep recurring laundry, parking, garage, and storage rent visible as its own line.
Applied to gross potential rent before other income.
Models collection shortfalls separately from physical vacancy.
Free rent, move-in credits, renewal incentives, or recurring lease concessions.
Dollar allowance for expected write-offs beyond the credit-loss percentage.
📊Six-Point EGI Snapshot
🧮Formula Table
| Line | Formula | Annualization | Use in EGI |
|---|---|---|---|
| Gross potential rent | Units x market rent per unit x 12 | Always annual | Starting rental income before losses |
| Other income | Other income + laundry and parking | Monthly mode x 12; annual mode x 1 | Added to gross potential rent |
| Vacancy loss | Gross potential rent x vacancy % | Annual dollars | Subtracted from income |
| Credit loss | Gross potential rent x credit loss % | Annual dollars | Subtracted from income |
| Fixed loss items | Concessions + bad debt | Monthly mode x 12; annual mode x 1 | Subtracted after percentage losses |
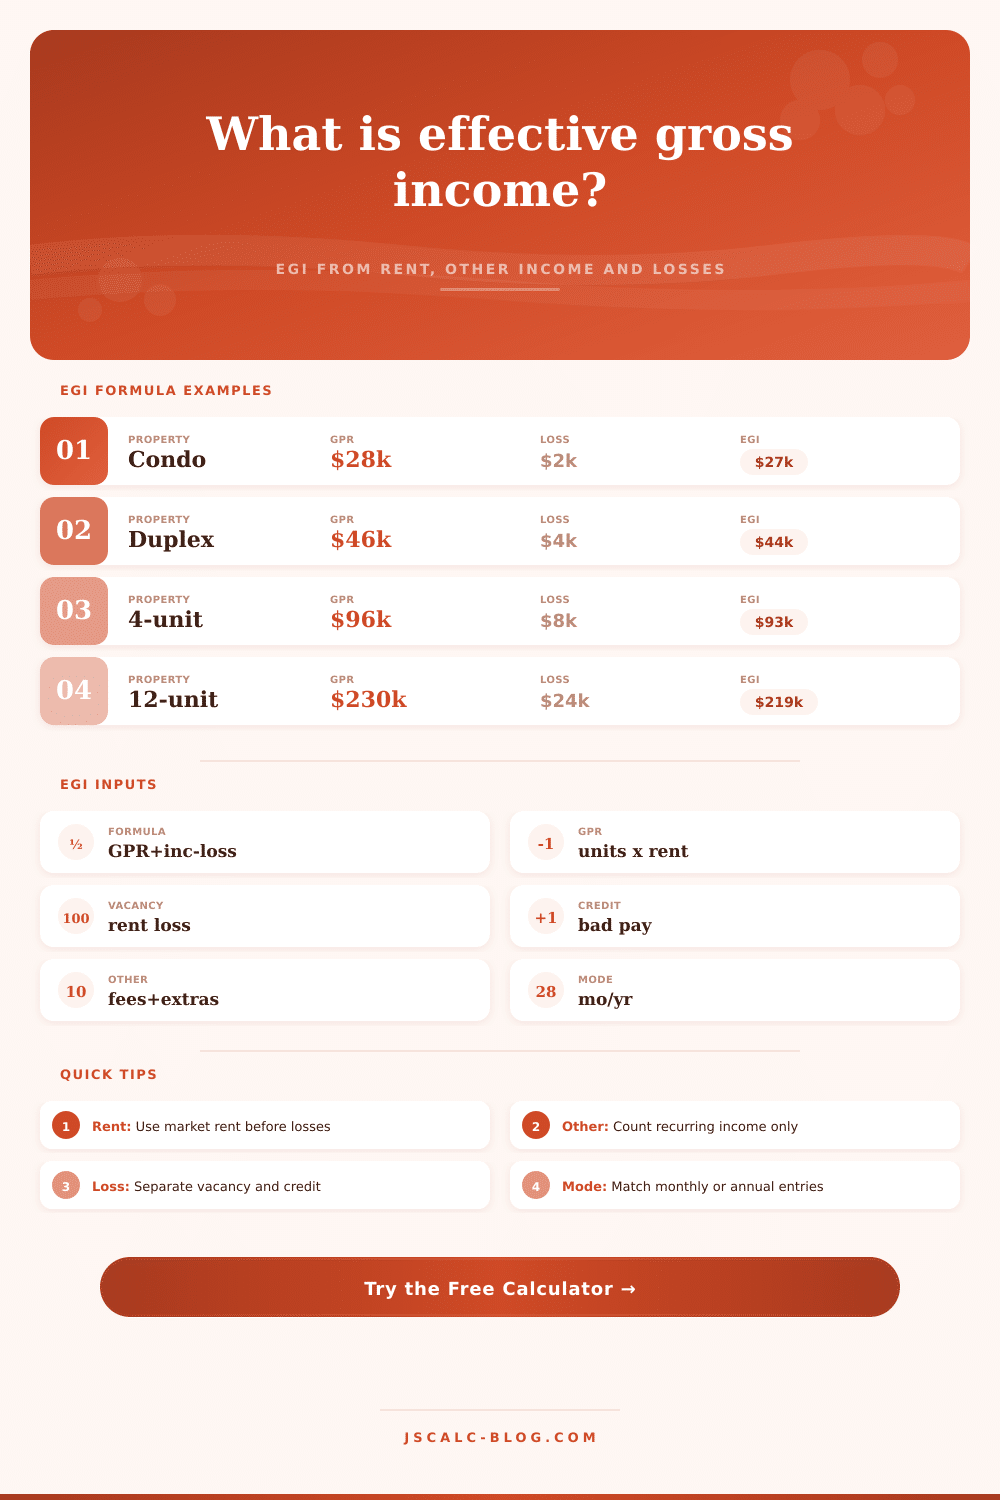
| Effective gross income | GPR + other income - vacancy and credit loss | Shown in selected period | Income line used before operating expenses |
🏢Property Profile Benchmarks
| Profile | Common vacancy check | Credit loss check | Income add-ons | EGI caution |
|---|---|---|---|---|
| Condo or single unit | 3% to 6% | 0.5% to 1.5% | Pet rent, storage | One vacancy can erase a month |
| Single-family rental | 3% to 7% | 0.5% to 2% | Pet rent, garage | Turnover timing drives loss |
| Duplex or triplex | 4% to 8% | 1% to 2.5% | Laundry, storage | Small unit count makes loss lumpy |
| Fourplex | 4% to 8% | 1% to 2.5% | Laundry, parking | Watch concessions during lease-up |
| Small apartment | 5% to 9% | 1.5% to 3% | Laundry, parking, RUBS | Use actual collection history |
| Student housing | 8% to 14% | 2% to 4% | Furnished rent, fees | Seasonality can distort monthly EGI |
| Mixed-use property | 4% to 10% | 1% to 3% | CAM, signage, parking | Separate commercial lease terms |
| Small retail property | 6% to 12% | 1% to 4% | CAM, parking, reimbursements | Tenant rollover changes quickly |
📋Income and Loss Classification
| Input | Income or loss | Applied to | Typical source | Calculator treatment |
|---|---|---|---|---|
| Market rent per unit | Income | Each rentable unit | Rent roll or market comp | Annualized as GPR |
| Other income | Income | Property level | Pet, storage, admin, reimbursements | Added after GPR |
| Laundry and parking | Income | Property level | Machines, reserved spaces, garages | Added as a visible add-on line |
| Vacancy percentage | Loss | Gross potential rent | Market vacancy, turn time | Subtracted from GPR |
| Credit loss percentage | Loss | Gross potential rent | Collections and delinquency history | Subtracted from GPR |
| Concessions | Loss | Property level | Free rent or lease incentives | Subtracted as fixed dollars |
| Bad debt allowance | Loss | Property level | Expected write-offs | Subtracted as fixed dollars |
🗂Preset Comparison Grid
| Scenario | Profile | Units | Rent/unit | GPR | Other income | Vacancy | Credit | Fixed loss | EGI | Loss rate |
|---|
📑Monthly vs Annual Mode
| Mode | Rent per unit | Other income fields | Loss dollar fields | Result display |
|---|---|---|---|---|
| Monthly entries | Still monthly market rent | Entered as monthly amounts, then multiplied by 12 | Entered as monthly amounts, then multiplied by 12 | Main cards show monthly values with annual context |
| Annual entries | Still monthly market rent | Entered as annual amounts | Entered as annual amounts | Main cards show annual values with monthly context |
| Why rent stays monthly | Matches GPR = units x rent x 12 | Prevents double-counting rent | Keeps losses comparable to annual GPR | Cleaner rental underwriting line |
💡Two Practical Tips
Many rental property arguments start by mixing up potential with income. You’ve got that apartment rented, right? Well, no, the check cleared on Wednesday instead of Tuesday. Sure, there were tenants in the place in January. But then they moved out after three weeks in February. You had it empty while you repainted and put up new ads. Gross potential rent forgets all that. It’s perfect-world stuff. Friction happens; and effective gross income includes it.
As soon as you enter local market rents and number of units into the calculator (above), the math is done for you. No need to pull out a spreadsheet and manually deduct vacancy losses and add back in shortfalls every time you want to re-run the numbers. So here’s the core calculation: pretty simple stuff, but it takes some discipline.
How to Calculate Real Rental Income
First you begin with Gross Potential Rent: the total number of units x each unit’s market rent x 12 months = your gross potential rent. Next you’ll tack on any recurring income: storage unit leases, laundry machine revenue, parking fees, pet deposits that remains on the books, etc.
Then you subtract your losses: this is where most pro formas goes awry. Everyone puts everything in one big “vacancy” line item. This is lazy underwriting. Instead, split out your physical vacancy from your credit loss. The former is when a physical unit go vacant (i.e., time between renters). The latter is the rent you receive that never reaches your bank account (because the tenant skipped town or otherwise defaulted). Keeping these two buckets distinct will allow you to diagnose issues down the road.
When your income falls, did your tenant just suck at paying rent? Or was she a bad lessee who should of been screened out? There is no one-size-fits-all vacancy rate; it differs across locations and types of properties. For instance, a three-percent buffer for turn time may be all that’s required for single family home located in a stable suburban area. Conversely, leases for a student housing complex adjacent to a university might easily stagger between 10 percent or more (during semester break periods). Before finalizing the deal, make sure to verify your assumptions with industry norms laid out in this reference table on the page. It is best to be slightly conservative rather than pleasantly surprised by a loan officer who knows what real vacancy looks like.
And give concessions their own line item as well. Move-in specials and free rent months (which is just another way of saying “discount on market rate”) may appear nice on paper, after all, you have a signed lease. But they hit your bottom line different than a vacant unit because they often come with signed leases that look good on paper until you realize you gave away three months of revenue to secure a twelve-month commitment.
Then there are the other tricky categories: bad debt. Bad debt isn’t just about tenants not paying. It also includes collection costs. Some tenants owes small balances of less than $50. Landlords write these off rather than spend the time and money to chase those few dollars. A reasonable bad debt allowance will ensure your numbers are realistic. You can input this as a percentage or a fixed dollar amount based off how you’ve historically tracked it.
For a steady forecast, look at your rent roll for historical data. For an off-market purchase study, lean on local market comps + add in a safety margin. But don’t underestimate period mode. You may notice seasonal trends when viewing in month vs year, yet the yearly total hide those trends. A huge swing in student housing EGI from fall to spring will appear flat as an EGI average. Summer parking income spikes (or vanishes) compared to winter months in a beachside community. By keeping the numbers front-and-center you prepare for any cash flow gap, instead of hoping your annual averages is sufficient to pay the light bill in leaner periods.
At the end of the day, gross income is your reality check; the thing that connects your raw potential to actual cash flow. It removes the illusion that everyone pays on time and no units ever sit vacant, and instead gives you something you can reliably count on. With this figure in hand, operating expenses feel less like a guess and more like a calculation. Instead of wondering whether the property will pay for itself, you know when it will break even. That is valuable information, even if it requires acknowledging your perfect rental roll includes some holes.