Customer Lifetime Value Calculator
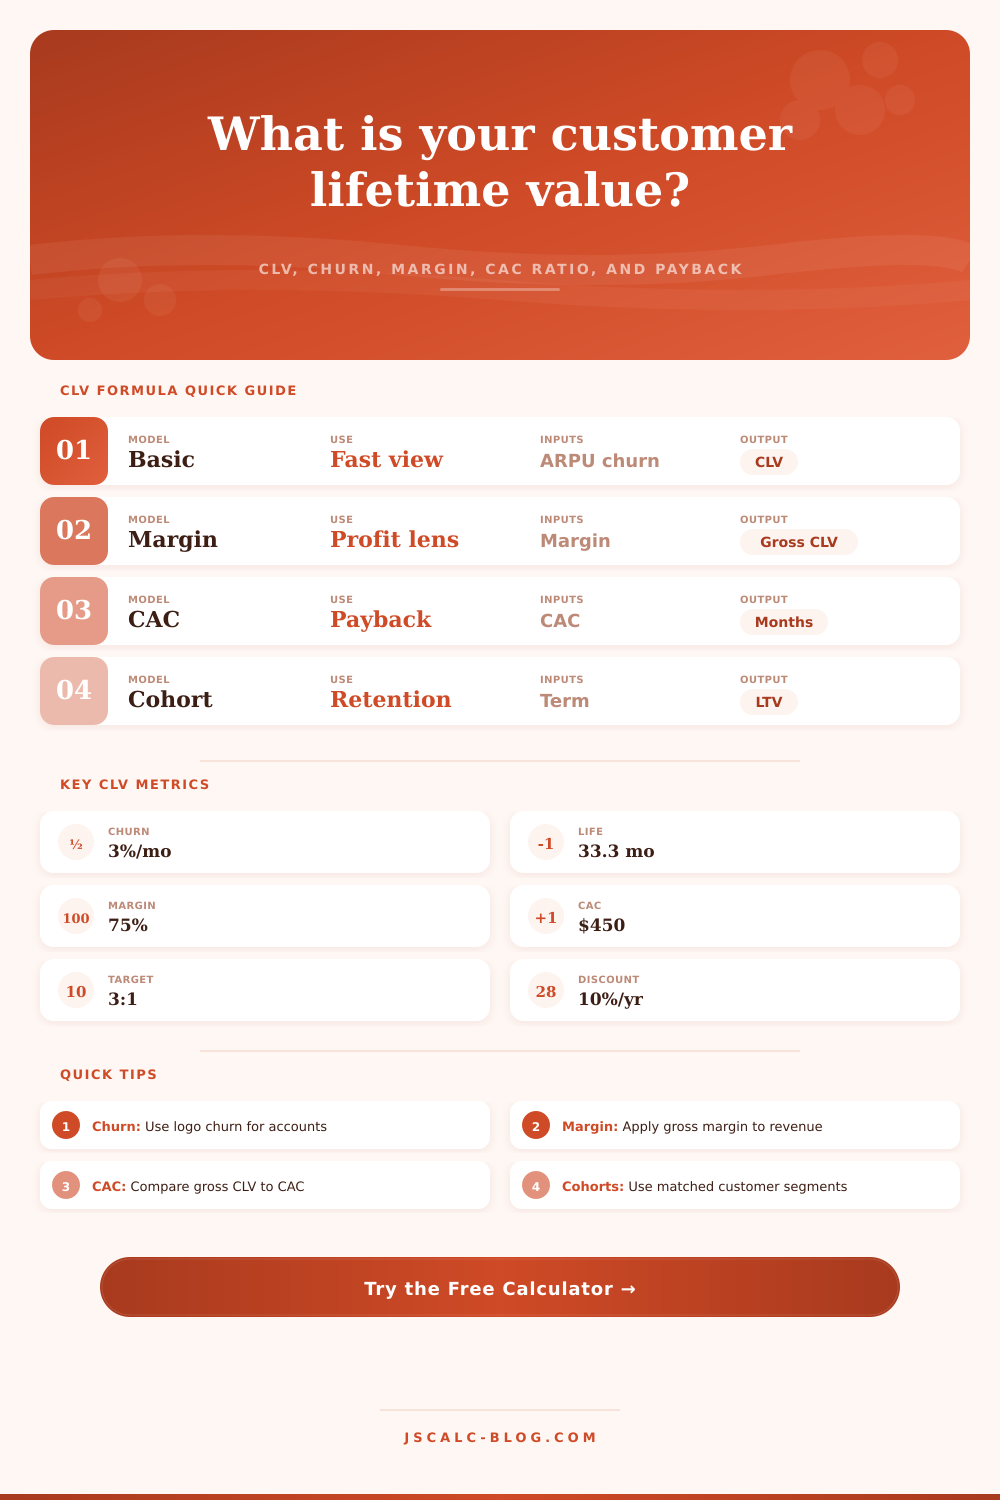
Estimate customer lifetime value from ARPU, purchase frequency, gross margin, churn, discount rate, retention horizon, and acquisition cost. The calculator reports revenue CLV, gross profit CLV, CAC ratio, payback period, average lifetime, and formula details.
🎯CLV Presets
🧮Customer Value Inputs
The model controls how average customer lifetime is estimated.
Segment adds benchmark context in the breakdown and snapshot.
Use monthly ARPU for subscription models or average order value for purchase models.
Enter 1 for monthly billing, 0.33 for quarterly buying, or 2 for twice monthly.
Use gross margin after delivery, support, processing, and service costs.
For churn-based CLV, lifetime equals 1 divided by monthly churn rate.
Used directly by cohort and contract models; caps the shown forecast table.
Include sales, ads, onboarding, discounts, commissions, and allocated campaign costs.
Discounting reduces future months to present value.
Use positive values for upsell or negative values for contraction after signup.
🔢Current CLV Snapshot
📊Customer Segment Benchmarks
| Segment | Typical Revenue Unit | Common Frequency | Margin Range | Churn Lens | Best CLV Model |
|---|---|---|---|---|---|
| B2B SaaS account | Monthly ARPA | 1 billing per month | 70% to 90% | Logo churn by account | Churn-based subscription |
| Repeat ecommerce customer | Average order value | Orders per month | 30% to 65% | Repeat window or cohort decay | Repeat purchase frequency |
| Consumer subscription | Monthly fee | 1 billing per month | 45% to 80% | Subscriber churn | Churn-based subscription |
| Agency or service retainer | Monthly retainer | 1 billing per month | 35% to 65% | Client churn | Contract account model |
| Marketplace buyer | Take-rate revenue | Transactions per month | 60% to 95% | Active buyer churn | Repeat purchase frequency |
| Mobile app subscriber | Net subscription revenue | 1 billing per month | 55% to 85% | Paid subscriber churn | Churn-based subscription |
| Membership or studio customer | Monthly membership | 1 billing per month | 40% to 70% | Active membership churn | Fixed retention horizon |
| Enterprise contract account | Monthly contract value | 1 billing per month | 65% to 90% | Renewal churn | Contract account model |
📈Preset Scenario Reference
| Scenario | Revenue Unit | Frequency | Margin | Monthly Churn | CAC | Expansion | Signal |
|---|---|---|---|---|---|---|---|
| B2B SaaS plan | $120 ARPA | 1.00 | 78% | 3.2% | $850 | 0.6% | Healthy payback |
| Repeat ecommerce | $64 order | 0.42 | 48% | 8.0% | $38 | 0.0% | Frequent orders matter |
| Consumer subscription | $19 fee | 1.00 | 64% | 6.5% | $72 | 0.2% | Churn sensitive |
| Agency retainer | $4,800 retainer | 1.00 | 42% | 4.0% | $6,500 | 0.4% | High value, slow CAC |
| Marketplace buyer | $22 take rate | 1.60 | 88% | 10.0% | $24 | 0.0% | Retention drives CLV |
| Mobile app subscriber | $8.99 net fee | 1.00 | 72% | 9.5% | $31 | -0.1% | Low ARPU pressure |
| Local membership | $89 membership | 1.00 | 58% | 7.0% | $145 | 0.1% | Payback under control |
| Enterprise account | $9,500 contract | 1.00 | 82% | 1.2% | $38,000 | 1.2% | Expansion changes value |
| Low margin retail | $55 basket | 0.75 | 24% | 12.0% | $29 | 0.0% | Margin limits CAC |
🧭CLV Ratio Interpretation
| Gross CLV to CAC | Plain Reading | Typical Action | Risk Check | Formula Lens |
|---|---|---|---|---|
| Below 1.0x | Customer value does not recover acquisition cost | Lower CAC, improve margin, or fix retention | Channel may be unprofitable | Gross CLV < CAC |
| 1.0x to 1.9x | Thin unit economics | Watch payback and retention closely | Small assumption changes can flip result | Gross CLV barely clears CAC |
| 2.0x to 2.9x | Developing economics | Scale cautiously with cohort checks | Forecast quality matters | CLV is useful but not roomy |
| 3.0x to 5.0x | Common healthy target range | Grow channels with stable cohorts | Do not ignore cash payback | Gross CLV supports CAC |
| Above 5.0x | Very strong modeled value | Check whether acquisition is underfunded | May signal underestimated CAC | Validate with actual cohorts |
⏱Retention Horizon Lookup
| Monthly Churn | Monthly Retention | Average Lifetime | 12-Month Survival | 36-Month Survival |
|---|---|---|---|---|
| 1% | 99% | 100.0 months | 88.6% | 69.6% |
| 2% | 98% | 50.0 months | 78.5% | 48.3% |
| 3% | 97% | 33.3 months | 69.4% | 33.4% |
| 5% | 95% | 20.0 months | 54.0% | 15.8% |
| 8% | 92% | 12.5 months | 36.8% | 5.0% |
| 12% | 88% | 8.3 months | 21.6% | 1.0% |
⚖Formula Method
💡CLV Modeling Tips
It’s true: You could spend thousands acquiring a customer through ads, only to have them leave after making a single purchase. How brutal! Unit economics is a reminder that you’re literally lighting money on fire.
Founders understandable obsess about the cost of their next lead; it comes out of your bank account today. But what most founders ignore is how much that customer will pay you over time.
Why Customer Lifetime Value Matters for Your Business
Customer lifetime value makes you think about the long term, not just what is right in front of you. It transforms marketing expenses into an investment calculation. A handful of data points plugged into the right formula usually help you tell the difference between knowing and guessing.
Churn is where people get tripped up the first time they use it. What exactly are you measuring? Are you measuring subscriber drop-off at an individual level for your consumer app? Or are you measuring logo churn for your enterprise accounts?
Define your monthly loss rate, and the calculator will do the math, sparing you from having to manually predict a downward trend. A tiny change of one percent in your monthly churn may not sound like much. But it makes a huge difference in the average lifetime of your client over three years.
Retention is a compounding force, and even small improvements early on will pay off massively later. That’s what most founders underestimate. They focus on bringing in new blood while their existing base quietly bleeds out.
In this case, revenue is a vanity metric. What’s valuable is your contribution value, which is your gross margin. A hundred-dollar sale might actualy be worth just twenty cents if you’re spending eighty cents on support, hosting, or delivery.
The tool helps you separate top-line revenue from gross profit CLV. This prevents you from over-optimizing for high-volume, low-margin sales. Because when you acquire customers, you pay in cash (not revenue). Your customer acquisition cost should be compared with the profit you get back, not the amount invoiced.
Lots of people make this mistake by comparing their acquisition cost to the total revenue a customer brings in, which results in an expensive growth strategy. Another metric people frequently overlook is the payback period.
While the raw ratio between CLV and CAC is sexy (and great for a pitch deck), it doesn’t tell you anything about when the money will come back. For instance, if it takes twenty months to get your customer acquisition costs back, you could of run out of money before you break even.
The calculator shows both the ratio and the payback period so that you have a full picture of how liquid your business is. Having healthy growth is all about having balance: you want to have a ratio that scales up (typically 3 to 1 or higher) but you also want a payback period that aligns with your financial reality. Speed and profitability are not mutually exclusive.
That’s why it matters when you’re calculating stuff, because you want to segment it. If you think about combining all of your customers and trying to get one “average”, well that averages over the important distinctions.
Your enterprise client with an assigned account manager is not going to behave in the same way as your self-serve user. That’s not an average of anything; it’s an average which doesn’t apply to anyone.
On the page there’s a reference table that explains how different types of transactions demand different types of models. Marketplace vs. A transaction for an agency retainer is totally different. If you try to treat them identically, you’ll make bad budget decisions.
Calculate CLV per unique set of cohorts and find out where your actual levers are. Subscriptions have a wildcard called expansion revenue. As your customers expand (add seats, upgrade), they increases in value over time.
To reflect this upside, enter an average expansion rate per month. Enter a negative number if you anticipate downgrades/contraction. Depending on this variable, a so-so initial sale can become a very profitable long term relationship.
Many SaaS companies accept a more expensive up-front acquisition because they’re banking on the future growth of existing account. The key is largely to understand what you’re really measuring. You don’t just buy a sale; you buy a relationship that will either deepen or wither.
In conclusion, use customer lifetime value as a sanity check on your business model. Use it to determine if you can afford to compete in whatever channel you choose. If your CLV does not exceed your CAC, don’t think that being operationally efficient will save you. Decrease your CAC, increase your retention or jack up your price.
Unit economics aren’t lying to you. They’re simply reflecting the assumptions that you feed them. Be honest with your inputs. Don’t give yourself an optimistic fantasy. Get a realistic view of your margin and churn. Know if the money coming in justifies the money going out. Then, and only then, can you scale with confidence rather than hope.