LTV to CAC Ratio Calculator
Estimate customer lifetime value from monthly revenue, gross margin, churn, expansion, discounting, and acquisition cost. The calculator reports LTV:CAC, CAC payback, maximum CAC at a target ratio, and benchmark interpretation.
🎯LTV:CAC Scenario Presets
🧮Customer Economics Inputs
Benchmarks adjust the interpretation, not your entered math.
Projection caps the value at the selected analysis window.
Use ARPA, average order contribution per active buyer, or monthly fee.
Enter gross margin after variable service, fulfillment, and support costs.
Customer churn, not revenue churn, unless your ARPA expansion is separate.
Use a negative value for contraction, downgrades, or lower repeat spend.
Include sales, marketing, onboarding incentives, and acquisition overhead.
Maximum CAC equals LTV divided by this target ratio.
Used for projected LTV to reduce far-future gross profit.
Longer windows matter most when churn is low.
🔢Current Unit Economics Snapshot
📐Formula Breakdown
📊Business Model Benchmark Grid
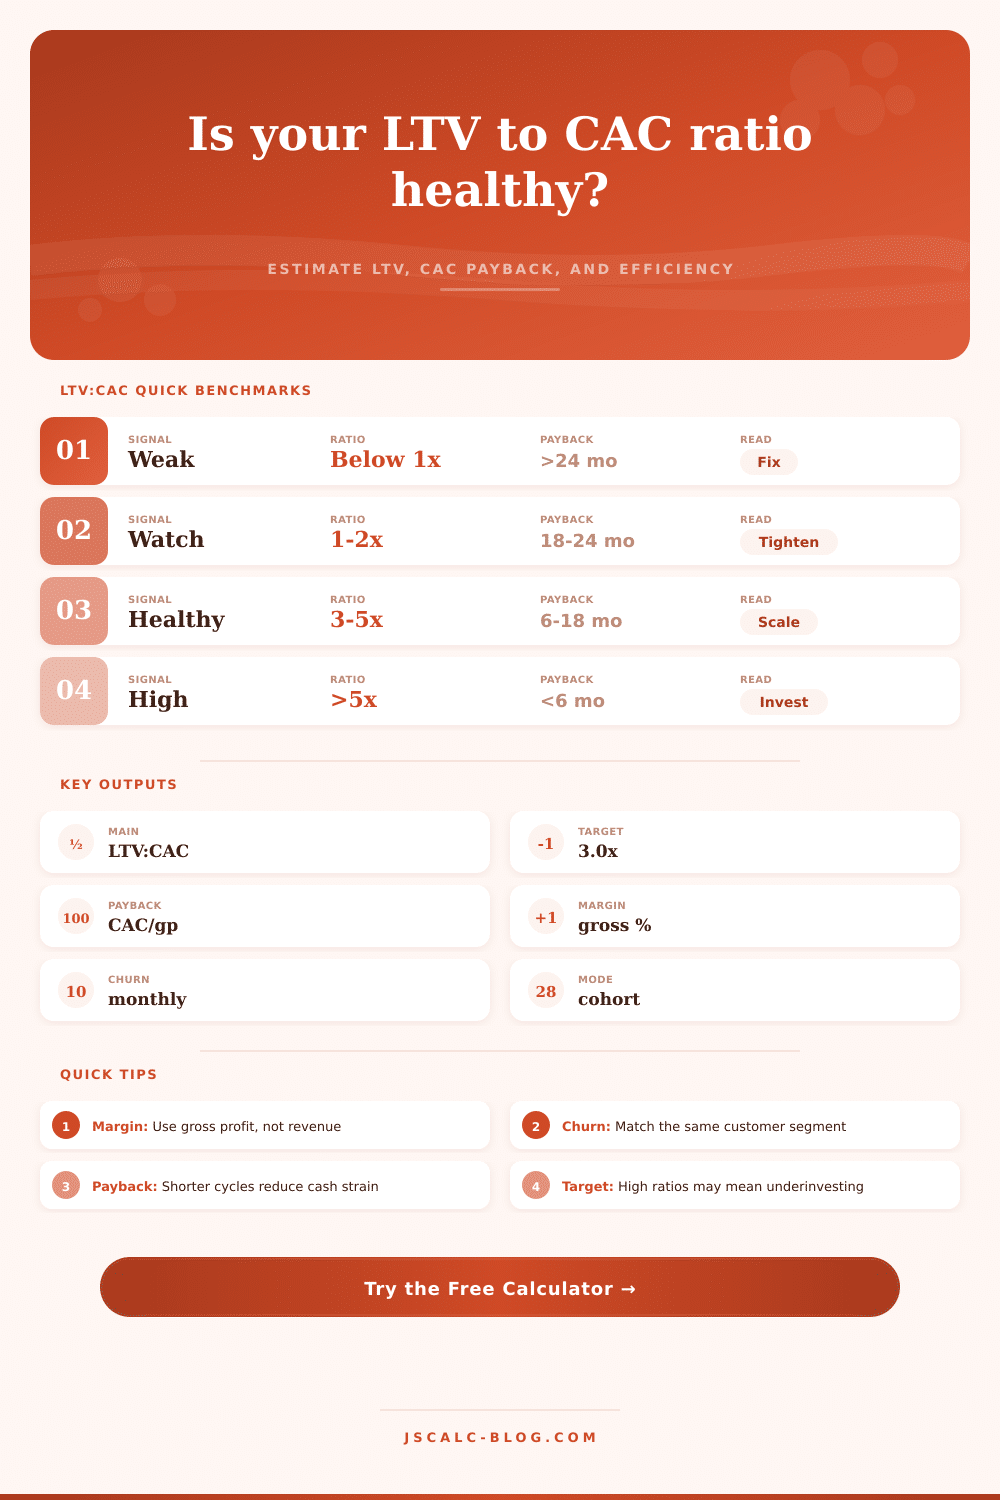
📋LTV:CAC Benchmark Reference
| Ratio Range | Efficiency Read | Typical Meaning | CAC Payback Check | Common Action |
|---|---|---|---|---|
| Below 1.0x | Value below acquisition cost | Each new customer may destroy gross profit | Usually too long | Lower CAC, improve margin, or fix retention |
| 1.0x to 1.9x | Weak recovery | Some value returns, but little room for overhead | Often above 18 months | Use careful testing before scaling spend |
| 2.0x to 2.9x | Developing efficiency | May work for fast-payback or strategic channels | Watch cash cycle closely | Segment campaigns and improve conversion quality |
| 3.0x to 5.0x | Healthy growth range | Common benchmark for scalable acquisition | Often 6 to 18 months | Scale channels with guardrail monitoring |
| Above 5.0x | Very high efficiency | Acquisition may be underfunded or CAC is understated | Often very short | Check measurement, then test more volume |
🧭Business Model Reference Table
| Model | Common Target | Payback Aim | Margin Pattern | Churn Focus | Measurement Caution |
|---|---|---|---|---|---|
| B2B SaaS | 3.0x to 5.0x | 12 to 18 months | High gross margin | Logo churn and expansion | Separate SMB and enterprise cohorts |
| Product-led trial | 2.5x to 4.0x | 6 to 12 months | High margin, lower sales cost | Activation quality | Exclude free users until paid conversion |
| Repeat ecommerce | 2.0x to 3.5x | 1 to 6 months | Fulfillment-sensitive | Purchase frequency | Use contribution margin after returns |
| Consumer subscription | 2.0x to 4.0x | 3 to 12 months | Varies by service cost | Month-one retention | Use cohort churn, not blended churn only |
| Marketplace buyer | 2.0x to 4.0x | 3 to 9 months | Take-rate driven | Repeat transactions | Use net revenue, not gross merchandise volume |
| Managed service | 3.0x to 5.0x | 6 to 18 months | Labor capacity matters | Retainer renewal | Include delivery hours in gross margin |
| Mobile app | 1.5x to 3.5x | 1 to 9 months | Platform fees matter | Trial and renewal churn | Measure paid acquisition by cohort source |
🗂Preset Scenario Comparison
| Preset | Revenue | Margin | Churn | Expansion | CAC | Method | Typical Read |
|---|---|---|---|---|---|---|---|
| B2B SaaS motion | $240/mo | 82% | 2.8% | 0.6% | $1,850 | Cohort | Healthy if payback stays near target |
| PLG trial funnel | $58/mo | 88% | 4.5% | 0.3% | $290 | Cohort | Efficient low-touch acquisition screen |
| Repeat ecommerce | $42/mo | 44% | 12.0% | -1.0% | $72 | Cohort | Payback should be fast |
| Mobile subscription | $16/mo | 68% | 9.5% | 0.0% | $52 | Cohort | Renewal quality drives the ratio |
| Marketplace buyer | $33/mo | 62% | 8.0% | 0.8% | $120 | Cohort | Repeat frequency matters most |
| Managed service | $950/mo | 47% | 3.2% | 0.2% | $4,200 | Net churn | Delivery margin controls scale quality |
| Early stage test | $110/mo | 72% | 7.0% | 0.0% | $780 | Cohort | Needs retention proof before scale |
| Efficient expansion | $420/mo | 84% | 1.8% | 1.0% | $2,600 | Net churn | Strong expansion can support higher CAC |
| Overpaid acquisition | $85/mo | 65% | 6.0% | 0.0% | $1,500 | Cohort | Ratio flags channel overpayment |
🔍Input Quality Checks
| Input | Use This | Avoid This | Why It Matters | Calculator Impact |
|---|---|---|---|---|
| Revenue | Average paid customer revenue for the cohort | Sitewide blended revenue including unpaid users | Blended revenue can hide weak paid cohorts | Moves LTV directly |
| Gross margin | Contribution after variable delivery cost | Revenue before fulfillment, support, or platform fees | LTV:CAC should compare gross profit to CAC | Changes both LTV and payback |
| Churn | Monthly churn for the same acquisition segment | Company-wide average across old and new cohorts | Acquired customers can retain differently | Changes customer lifespan |
| Expansion | Observed upsell, usage growth, or repeat spend lift | Unproven roadmap assumptions | Small expansion rates compound strongly | Can materially raise LTV |
| CAC | Fully loaded channel acquisition cost | Ad spend only when sales labor is material | Understated CAC overstates efficiency | Moves ratio and headroom |
| Window | Time horizon aligned with payback discipline | Very long projection for uncertain cohorts | Distant value is less certain | Caps projected LTV |
💡Practical LTV:CAC Tips
Sure, you might go out and blow a bunch of cash on marketing. But what happens when that customer leaves after they’ve spent less than their worth? In that case, the business model doesn’t hold up. In this case, you’re not operating a viable business. You’re throwing money at your marketing team and nothing more.
For all its investor-related uses, LTV/CAC represent an indicator of unit economics… Does this business work? Once you plug in your revenue, margin, and churn numbers into the calculator, it do all that math for you.
How to Use This Tool to Check Your Business
It forces you to use gross profit instead of revenue. A lot of entrepreneurs only care about their top line sales number which is where they get all fuzzy. That’s why you need to think in terms of gross profit rather than revenue. The cash you actualy keep is what pays back the acquisition cost. You’re overvaluing the worth of every customer if you don’t account for server, fulfillment, or support costs.
The other key input is monthly churn. This sounds obvious but gets screwed up here and it blows the whole thing. Over 3 years, a percent point shift in retention move your LTV by hundreds of dollars. There are two ways the tool lets you do this. One is a simple net churn formula. But the other, a cohort projection, is more strict. You see how customers realy leave. This limits the value to a specific time window and prevents you from counting revenue that might not occur.
Second, it’s about expansion revenue: Does the customer purchase additional products in the future? That extra spend contributes to the value of the customer. Even if it’s small and positive, it can offset some acquisition cost. This is the big difference here; you can plug in expansion into the calculator separately. Many simple calculators assumes no expansion, but real companies either grow with their customers or they downgrade. Knowing the actual expansion rates allows for a conservative vs. This allows for a realistic estimate.
Look carefully at the payback period in the output. Three-to-one isn’t bad, but if you’ll only break even after thirty months, then you could be out of money before that happens. More startups die from cash-flow issues than they do from long-term unit economics issues. How do you know? Well, the reference table tells you.
Two-to-one works well for fast-payback ecommerce. But it’s too aggressive for long-cycle B2B software. What’s reasonable depends on context.
The second number, the ratio… Also deserve careful monitoring. A ratio greater than five to one could indicate that you’re not investing enough for growth. As long as it remains profitable to acquire new customers, you can afford to spend more. This tool will calculate the max acquisition cost at which you should stop based on your desired ratio. So think of that as a guardrail.
Are your real-world costs significantly lower than that? Consider increasing spend or trying different customer-acquisition channels. What it tells you is where the problems lie. Is the ad cost too high? -> Is the ad cost too high? You can’t improve what you don’t measure, and you can’t scale a losing business.
Try varying inputs to see what works. For example, if you make your product more efficient, you can increase margins. Try dropping the churn by half a percent to see how it affects the ratio. Observe how this impacts the ratio.
Discipline is essential. Understand exactly what it costs you to acquire a customer. Understand exactly how much that customer pays back in the long run. Intuition won’t get you there; the math will.
Keep a healthy ratio and monitor the payback period to prepare for continued expansion. Don’t expect instant returns. Expect long-term financial security.