Churn Rate Calculator
Measure customer churn, logo retention, revenue churn, net revenue retention, annualized churn, and the new-customer growth needed to offset losses for a subscription or recurring revenue business.
🎯Churn Scenario Presets
🧮Churn Inputs
Benchmark changes the health signal and target comparison.
Annualized rate compounds the observed period churn.
Use the active customer count at the start of the period.
Include cancellations and accounts that failed to renew.
New customers offset growth, but they are not in the churn denominator.
Use opening MRR, ARR divided by 12, or period recurring revenue.
Recurring revenue removed when customers fully churn.
Contraction from customers who stayed but reduced plan value.
Upgrades, add-ons, seats, or usage expansion from the starting base.
Used for gap analysis against your selected churn goal.
🔢Current Churn Snapshot
📊Model Benchmarks
📋Preset Reference Table
| Scenario | Starting Customers | Lost Customers | New Customers | Starting Revenue | Lost Revenue | Downgrade | Expansion | Read |
|---|---|---|---|---|---|---|---|---|
| Stable SaaS month | 2,500 | 82 | 155 | 185,000 | 7,100 | 2,300 | 6,100 | Good logo churn with modest NRR |
| Early-stage spike | 420 | 38 | 64 | 31,500 | 3,900 | 1,200 | 900 | High churn despite acquisition |
| Enterprise renewal cycle | 188 | 3 | 7 | 620,000 | 18,000 | 11,000 | 72,000 | Low logo loss, strong expansion |
| Membership app cohort | 8,600 | 540 | 735 | 146,200 | 9,180 | 1,360 | 2,120 | Churn needs retention work |
| Creator newsletter plan | 1,240 | 118 | 132 | 18,600 | 1,770 | 240 | 315 | Churn is acquisition-heavy |
| Usage expansion month | 960 | 21 | 48 | 210,000 | 4,800 | 3,700 | 32,500 | Expansion masks some churn |
| Seasonal cancellation wave | 3,300 | 310 | 190 | 99,000 | 9,300 | 2,900 | 1,600 | Net customer count shrinks |
| Downgrade-heavy quarter | 1,150 | 56 | 88 | 265,000 | 13,400 | 26,500 | 14,200 | Revenue churn exceeds logo churn |
| Recovery sprint month | 1,780 | 49 | 121 | 142,400 | 4,100 | 1,900 | 9,700 | Retention and expansion improving |
🧭Monthly Customer Churn Interpretation
| Monthly Churn | Logo Retention | Annualized Loss | Common Reading | Operating Focus |
|---|---|---|---|---|
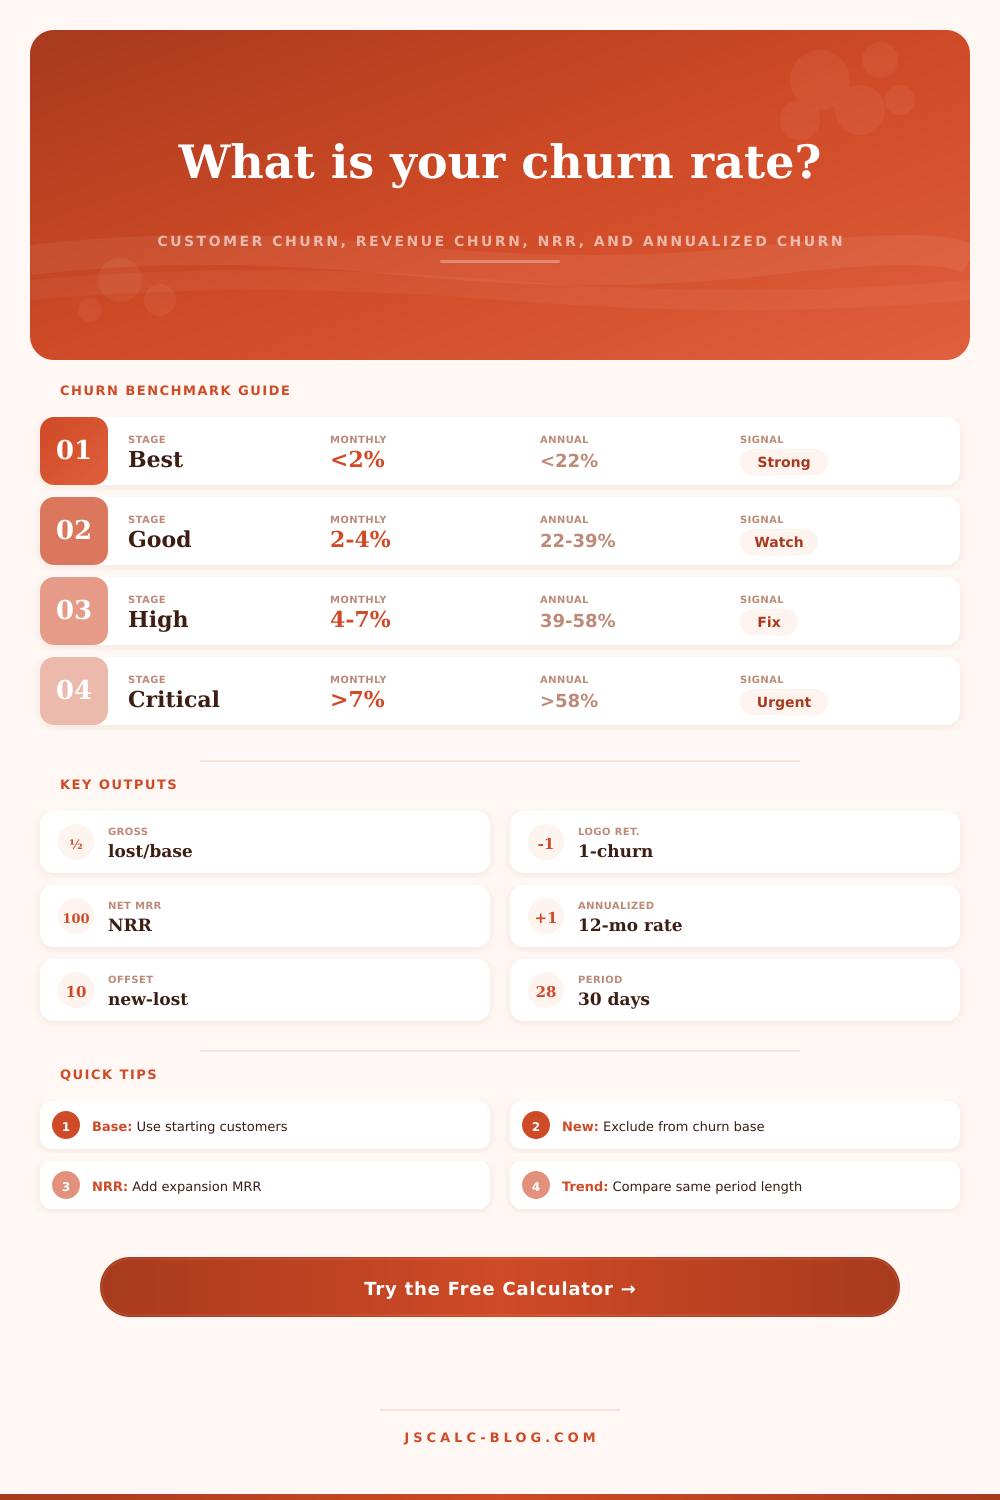
| Below 1% | Above 99% | Below 12% | Excellent for most recurring models | Protect retention drivers |
| 1% to 3% | 97% to 99% | 11% to 31% | Healthy SaaS or B2B range | Improve onboarding and value proof |
| 3% to 5% | 95% to 97% | 31% to 46% | Manageable but growth drag is visible | Segment cancellations by cause |
| 5% to 8% | 92% to 95% | 46% to 63% | High churn for many paid plans | Fix activation and renewal friction |
| 8% to 12% | 88% to 92% | 63% to 78% | Retention risk is severe | Review fit, pricing, and promises |
| Above 12% | Below 88% | Above 78% | Acquisition must replace a large base | Prioritize retention before scale |
💳Revenue Retention Reference
| Metric | Formula | Strong Signal | Risk Signal | Use Case |
|---|---|---|---|---|
| Gross revenue churn | (churned revenue + downgrade revenue) / start revenue | Below 3% monthly | Above 6% monthly | Measures revenue lost before expansion |
| Gross revenue retention | 1 - gross revenue churn | 97%+ monthly | Below 94% monthly | Shows retained opening revenue |
| Net revenue retention | (start revenue - losses + expansion) / start revenue | 100%+ monthly | Below 95% monthly | Shows expansion after churn and contraction |
| Net revenue churn | (losses - expansion) / start revenue | Negative or near 0% | Above 5% monthly | Shows whether expansion covers losses |
| Downgrade share | downgrade revenue / total revenue loss | Below 25% | Above 50% | Separates plan contraction from full churn |
| Expansion coverage | expansion revenue / revenue loss | 100%+ | Below 50% | Shows how much expansion offsets loss |
⚙Churn Formula Breakdown
🔍Common Counting Choices
| Counting Choice | Recommended Treatment | Why It Matters | Example | Calculator Field |
|---|---|---|---|---|
| New customers | Exclude from churn denominator | Churn measures loss from the opening base | New March signups are not March base | New customers added |
| Pauses | Count only if access or billing stops | Pause rules vary by product policy | Paused account may return next month | Customers lost |
| Failed payments | Count after retry or grace period ends | Early failed payments can be recovered | Dunning recovers card update | Customers lost |
| Downgrades | Keep as revenue contraction, not logo churn | Customer remains active but pays less | Team drops from 20 seats to 12 seats | Downgrade revenue |
| Expansion | Include only from existing customers | New customer revenue is acquisition, not NRR | Existing account adds add-on module | Expansion revenue |
| Annual contracts | Match churn to renewal timing | Contract loss appears at renewal date | One annual customer fails to renew | Period and lost customers |
💡Churn Measurement Tips
Growth is taxed by Churn. This month you might be able to sign up a thousand new customers. But what happens when half of them depart in February? You’re not building a business; youre just filling a leaky bucket.
The churn rate is metric that tells you how quickly that bucket will drain. On the surface, it sounds simple: Just divide lost customers by total. In practice, however, the reality are messier. Customers leaves for all sorts of reasons and revenue isnt always lost at the same rate as headcount. It’s that difference between losing dollars versus losing a logo that trips up most operator.
How to Measure Customer Churn
To get the math done for you, use the calculator above. It will break out both sides… Revenue churn and customer churn. So that you can see the whole story.
Losing a small business doesn’t hurt your bottom line much. However, losing a large enterprise realy impacts it. So you could look at the number of accounts lost and think “oh well, I retained my big clients, so my retention isn’t bad.” But in reality, those small account are being siphoned off, which pulls down your overall revenue retention.
The tool also shows what growth revenue youre gaining from account expansions. This way, you can track your net revenue retention, or NRR. A score greater than one hundred percent show that your current base is generating enough new revenue to offset losses (and even create additional value). That’s the holy grail of recurring revenue.
That’s the first step: get the proper baseline. How many active customers did you have at the beginning of the period? Not anybody who signed up mid-month. Churn captures loss of your current base. Acquisition is a different story, involving new customers. Sure, they offset the loss. But they don’t stop the leak. Diluting the signal with new signups wont help. Your churn percentage will look better then it is. You’ll feel good, but the number is artificially lowered by all the fresh blood you just pumped in.
Once you plug in your starting numbers, the calculator does the rest, saving you from having to guess at periods and coefficients. Time distorts things. Two percent per month churn doesn’t sound bad. But it compounds to twenty-two percent on an annual basis. That’s a massive chunk of your recurring revenue youre losing every year. The annualized number is what keeps founders up at night. It illustrates how badly you’re eroding, year after year, unless you change something.
You can also compare your period vs. Benchmarks. If you have self-serve software, expect higher turnover than enterprise contracts. Comparing your startup churn rate with an enterprise benchmark will cause unnecessary panic. Comparing your enterprise rate with a startup benchmark will make you too comfortabley.
Your shield against churn is expansion revenue. As long as people buy more or add seats, they’re staying. Why? Because now they’re invested. They don’t want to walk away. So that’s why the calculator asks for expansion data on top of everything else. This helps you understand whether your growth is coming from deeper relationships with existing customers, which is much more sustainable. You’ll never outspend yourself trying to sell upgrades; you would of always spend less selling an upgrade than finding a new customer.
If you have positive net revenue retention, you can literally shut down your acquisition engine for a month and still grow. That’s a powerful position to be in. It means the product is doing its job.
Downgrade: Failing to account for downgrades. Switching from a pro plan to a basic plan isnt technically a churn event, because the customer is still on the books. Yet it’s a downgrade, and it do reduce your revenue. Hiding a contraction in your wallet by treating them as fully retained. The tool treats these separately (logo loss vs. Revenue loss) to force you to face the truth about the value you are delivering. Downgrades mean they’re not getting the value they need. Marketing won’t fix that. You gotta go back to the product.
Churn isnt so much a math problem as a diagnostic one. You’re already told what’s going on with the number. Why? The segmentation shows you that. Examine churn by plan, by cohort, by industry. What’s the pattern? Patch the leak. Where is it leaking? Until you do, its like youre just pouring water in a hole.
Zero churn isnt the goal. It can’t be done. Manageable, predictable churn that you can easily outpace with your growth (that’s the goal).