Retention Rate Calculator
Measure how much of a starting customer, subscriber, or user base stayed active through a selected period. The calculator reports retained users, retention rate, churn rate, equivalent monthly retention, benchmark gap, and next-period projection.
🎯Retention Presets
🧮Retention Inputs
The selected mode controls which retained count the formula uses.
Benchmarks are planning references; compare like-for-like periods.
Used for monthly equivalent and daily retention calculations.
Projects the starting base forward at the observed retention rate.
The eligible base at the beginning of the retention window.
Total active base at the end, including new and reactivated users.
Subtract this for standard period retention.
Keep reactivations visible so they do not inflate retained existing users.
Used directly for cohort, renewal, and event retention modes.
Leave as your internal goal or use the segment reference table below.
🔢Current Retention Snapshot
📐Formula Breakdown
📋Preset Retention Scenarios
| Scenario | Mode | Segment | Start | End Active | New | React. | Retained Used | Period | Typical Read |
|---|---|---|---|---|---|---|---|---|---|
| SaaS monthly renewal | Period | B2B SaaS | 1,200 | 1,185 | 170 | 35 | 980 | 30 days | Healthy but target-sensitive |
| Mobile app Day 7 | Event | Consumer app | 18,000 | 8,700 | 0 | 0 | 5,940 | 7 days | Early product stickiness |
| Ecommerce 90-day repeat | Cohort | Ecommerce | 4,800 | 2,010 | 0 | 0 | 1,390 | 90 days | Repeat purchase window |
| Newsletter active month | Period | Newsletter | 22,500 | 23,100 | 2,900 | 420 | 19,780 | 30 days | Stable subscriber activity |
| Course checkpoint | Cohort | Education | 760 | 515 | 0 | 0 | 515 | 21 days | Mid-course completion signal |
| Marketplace buyer month | Period | Marketplace | 9,600 | 9,180 | 1,850 | 510 | 6,820 | 30 days | Repeat demand pulse |
| Community weekly return | Event | Community | 3,400 | 2,210 | 0 | 0 | 1,920 | 7 days | Habit loop measurement |
| Enterprise annual logos | Renewal | Enterprise | 420 | 397 | 0 | 0 | 388 | 365 days | Logo renewal strength |
| Product-led trial month | Cohort | B2B SaaS | 2,300 | 1,020 | 0 | 0 | 735 | 30 days | Activation to retained usage |
🧭Retention Mode Reference
| Mode | Best For | Required Count | Formula Used | Main Caution |
|---|---|---|---|---|
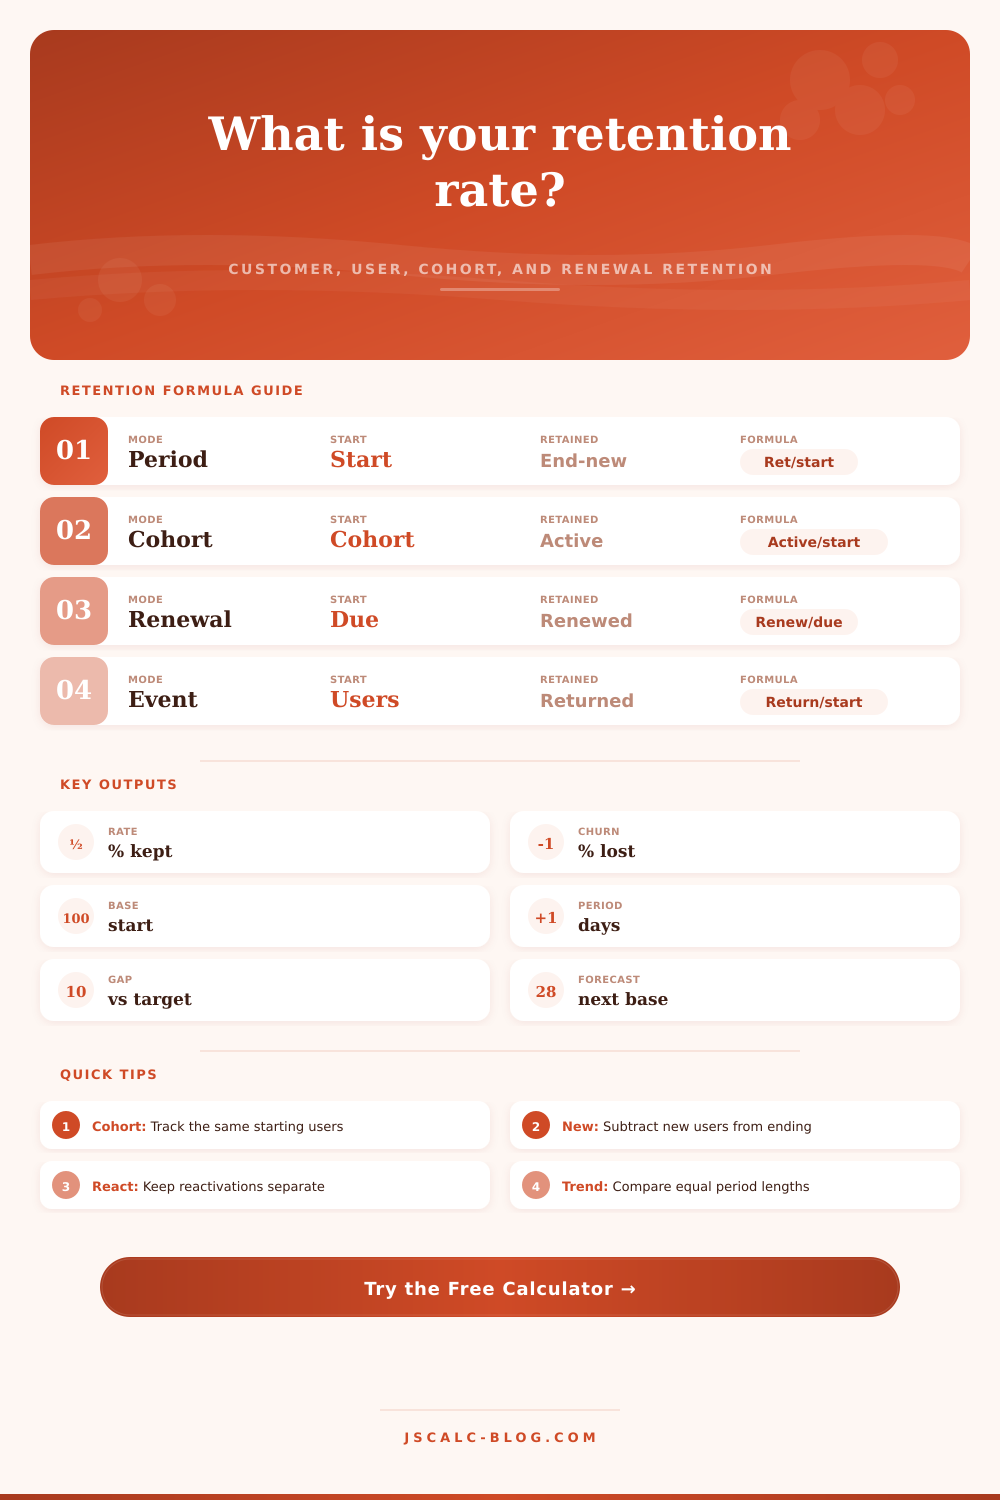
| Period retention | Customer base reporting | Ending active, new, reactivated | (End - new - react) / start | New growth can hide churn |
| Cohort retention | Signup or purchase cohorts | Known retained from the same cohort | Retained cohort / start | Do not mix later signups |
| Renewal retention | Subscriptions and contract logos | Accounts renewed from due base | Renewed / due | Expansion revenue is separate |
| Event retention | Apps, communities, product habits | Triggered users who returned | Returned / triggered | Define the return action first |
| Rolling retention | Usage after a chosen day | Users active on or after day N | Active after day N / start | Not the same as exact-day retention |
| Survival retention | Long lifecycle analysis | Still active at each interval | Interval survivors / start | Needs consistent censoring rules |
📊Segment Planning Benchmarks
| Segment | Common Window | Watch Zone | Solid Zone | Strong Zone |
|---|---|---|---|---|
| B2B SaaS subscribers | 30 days | Below 80% | 85% to 92% | Above 92% |
| Consumer mobile app users | 7 days | Below 20% | 25% to 40% | Above 40% |
| Ecommerce repeat buyers | 90 days | Below 18% | 25% to 40% | Above 40% |
| Newsletter subscribers | 30 days | Below 70% | 78% to 88% | Above 88% |
| Course or education cohort | 21 days | Below 55% | 65% to 80% | Above 80% |
| Marketplace active buyers | 30 days | Below 55% | 65% to 78% | Above 78% |
| Community members | 7 days | Below 35% | 45% to 60% | Above 60% |
| Enterprise logo renewals | 365 days | Below 85% | 90% to 95% | Above 95% |
🕑Common Retention Windows
| Window | Often Used For | Returned Means | Good Companion Metric | Calculator Tip |
|---|---|---|---|---|
| Day 1 | New app or product activation | Came back the next day | First value action completed | Use event mode |
| Day 7 | Habit-forming products | Active in the first week | Weekly active rate | Compare to weekly return table |
| Day 14 | Trial onboarding | Used the product after setup | Activation depth | Use cohort mode |
| 30 days | Monthly subscriptions | Still active or renewed monthly | Logo churn | Use period or renewal mode |
| 90 days | Repeat purchase behavior | Made another purchase or visit | Purchase frequency | Use cohort mode |
| 365 days | Annual renewals | Renewed after contract term | Renewal due base | Use renewal mode |
💡Retention Calculation Tips
Users cost dollars to acquire and then they goes away within a couple of weeks. It is a universal business pain point. Attention is around acquisition; profit is around retention. Most founders thinks about acquiring new customer without understanding that their existing base have holes. Measuring retention (who sticks around and who doesn’t), are what makes or breaks a subscription business. You can’t fix something if you don’t know how to measure it.
Retention isn’t one size fits all. You have to know what you’re measuring. If you’re a SaaS business looking at renewal rates by month, you need a different view different than a mobile app team that cares about return after Day 7.
Why Measuring Retention Matters
Once you choose the proper retention mode for your situation, the calculator do the math so you don’t get confused between loyalty of current users and acquisition of new ones. Retention over a period mean you’re looking at how many people joined at the beginning who are still around now, without taking into account anyone who signed up since then. That’s important because total number of active users can skew your perception. Your base could appear to be growing and therefore healthy, when in reality you’re simply swapping out churned user for new ones so your loyalty hasn’t improved. The tool breaks this down so you can understand what’s really happening with the trend.
For product-led growth companies, cohort retention, tracking of a group of people from the day they signed up until today… Is essential. If you have a user who signed up in January, how many of them is still using your product in March? In April? On this page, you can find typical benchmarks (the reference table) for these scenarios. So if you see 20 percent Day 7 retention as a consumer app, that’s a red flag that something isn’t working right with your onboarding experience, and you should of look at improving it.
A raw number on its own is just data. But with a benchmark, it becomes a diagnostic tool. It lets you see where you stand versus industry standards and get a reality check.
For B2B companies, the place the money is is renewal retention. In this case, you want to look at logo retention, which asks if the people who should of renewed their accounts actualy did. The calculator calculate the logo retention and compares your target to your actual results. So if you’re shooting for 95% retention and you end up with 90%, you’ve got five percent gap of actual revenue loss. It is not some stat; it is contracts you failed to keep. There is also a projection function that lets you see what happens over time based off the current churn rate. How large will your base be in 6 months if you continue to churn like this? Often that projection give you more insight then any single month’s report.
Reactivation vs. Retention: A lot of folks conflate the two, just because someone who hasn’t used an app in a while returns doesn’t mean you retained them in the classic meaning. Your tool should let you set apart reactivated users, which will help prevent exaggerated loyalty metrics from artificial inflows. You don’t want to know how well your emails gets inactive users to come back; you want to know how well your product get people and keeps them. That’s a slight distinction, but one that will alter how you use your resources. Are you mostly reactivating? Do you have a core cohort that isn’t sticking around? Then you’ve got a different issue.
Churn = Product-Market Fit: If folks aren’t seeing enough value in your product to stick around, then they don’t have product-market fit. If your churn is low, that’s great, because you’re not paying to fill a bucket without a bottom. If possible, distinguish between new growth, reactivation, and true retained customer. This will show you where the leaks are. It’s simple math but it’s difficult to get disciplined about tracking this properly. Pick a time window and cohort, start measuring it, and keep doing that. Then use those numbers to guide product improvements instead of simply reporting on them. You want to understand why the number is what it is; then you’ll know how to plug up the holes, one user at a time.