Net Revenue Retention Calculator
Measure retained recurring revenue from an existing customer cohort. Enter opening revenue, expansion, contraction, churn, and account counts to calculate NRR, GRR, expansion offset, churn drag, account retention, and target expansion needed.
🎯NRR Scenario Presets
🧮Retention Inputs
Use the same cadence for every revenue field.
The benchmark card adapts to the selected motion.
Currency changes display only; formulas are unchanged.
Many teams exclude reactivations and track them separately.
Starting revenue from customers active at period start.
Upsells, cross-sells, usage growth, and seat growth.
Revenue lost from retained accounts that spend less.
Revenue from starting customers that fully left.
Optional returning customer revenue, never brand-new logos.
Used to backsolve the expansion gap for this cohort.
Count customers in the opening cohort only.
Accounts from the opening cohort still active at period end.
🔢Current Cohort Snapshot
📐NRR Formula Breakdown
📊Segment Benchmark Guide
| Segment | Watch Zone | Healthy Zone | Strong Zone | Best Signal | Typical Risk |
|---|---|---|---|---|---|
| Blended SaaS portfolio | Below 100% NRR | 100% to 110% NRR | 110%+ NRR | Expansion covers contraction plus churn | Mixed segments hide weak cohorts |
| Enterprise accounts | Below 105% NRR | 110% to 125% NRR | 125%+ NRR | Seat growth and cross-sell expansion | Large-logo churn swings results |
| Mid-market accounts | Below 100% NRR | 105% to 115% NRR | 115%+ NRR | Upgrade path offsets downgrades | Budget cuts cause contraction |
| SMB self-serve accounts | Below 90% NRR | 95% to 105% NRR | 105%+ NRR | Low logo churn and add-ons | High logo churn overwhelms upsell |
| Usage-based customers | Below 105% NRR | 110% to 130% NRR | 130%+ NRR | Consumption expands after adoption | Usage drops look like contraction |
| Product-led subscriptions | Below 95% NRR | 100% to 112% NRR | 112%+ NRR | Team invites and plan upgrades | Small accounts churn quickly |
| Managed service retainers | Below 90% NRR | 95% to 105% NRR | 105%+ NRR | Scope expansion within retained clients | Project scope compression |
🧭Preset Scenario Reference
| Scenario | Opening Rev | Expansion | Contraction | Churn | NRR | GRR | Plain Read |
|---|---|---|---|---|---|---|---|
| Enterprise expansion | $8.0M | $2.2M | $0.25M | $0.35M | 120.0% | 92.5% | Expansion-led benchmark result |
| Mid-market baseline | $3.5M | $0.42M | $0.18M | $0.22M | 100.6% | 88.6% | Barely expanding after losses |
| SMB churn pressure | $850K | $80K | $55K | $170K | 82.9% | 73.5% | Revenue base is shrinking |
| Usage-based growth | $1.9M | $620K | $120K | $95K | 121.3% | 88.7% | Consumption growth offsets loss |
| Downgrade wave | $2.4M | $210K | $390K | $180K | 85.0% | 76.3% | Contraction is the main drag |
| Expansion recovery | $1.2M | $260K | $85K | $75K | 108.3% | 86.7% | Expansion covers revenue loss |
| Quarterly cohort | $640K | $88K | $22K | $38K | 104.4% | 90.6% | Short-period cohort is healthy |
| Founder-led SaaS | $220K | $39K | $8K | $18K | 105.9% | 88.2% | Small base with useful expansion |
| Target backsolve | $5.0M | $450K | $250K | $300K | 98.0% | 89.0% | Needs more expansion to hit 115% |
⚖Metric Comparison Table
| Metric | Includes Expansion | Includes Churn | New Customer Revenue | Main Use |
|---|---|---|---|---|
| NRR | Yes | Yes | Excluded | Measures growth from existing customers |
| GRR | No | Yes | Excluded | Measures retained revenue before upsell |
| Logo retention | No | Account churn only | Excluded | Shows account count retention |
| Expansion rate | Expansion only | No | Excluded | Shows upsell pace against opening base |
| Revenue churn rate | No | Contraction plus churn | Excluded | Shows recurring revenue lost from cohort |
| Total ARR growth | Yes | Yes | Included | Company growth across all customers |
🔍Retention Quality Checks
| Check | Use This Rule | Good Sign | Risk Sign | Why It Matters |
|---|---|---|---|---|
| Cohort lock | Use customers active at period start | No new logos included | New ARR mixed into NRR | NRR should isolate existing customers |
| Same cadence | ARR with ARR, MRR with MRR | All fields share cadence | Monthly expansion against ARR base | Mixed periods distort retention |
| Contraction split | Separate downgrade from churn | Clear loss source | All loss dumped into churn | Fixes differ by loss type |
| Reactivation policy | Apply consistently | Tracked outside new ARR | Reactivations boost NRR one period | Policy affects trend comparability |
| Segment view | Slice by motion or size | Enterprise, SMB, PLG separated | Blended average hides weak cells | Benchmarks differ by segment |
| Account count | Pair NRR with logo retention | High NRR and stable accounts | High NRR despite many churned accounts | Upsell can mask customer loss |
💡Practical NRR Tips
A lot of SaaS founders spends all their time trying to win new logos, only to realize they’ve slowly lost revenue from there base. It’s easy to fall into this trap, winning a new logo is noisy and expensive, whereas losing an old one are silent and slow.
Net revenue retention flips the story, making you consider health of your current group. Plug in your churn, contraction, expansion, and starting revenue numbers into the calculator above, and it do the math for you. It saves you from wading through formula-filled spreadsheets where you’ll inevitablly miss some subtle interaction.
Why Keeping Current Customers Is Important
It’s a simple idea. So simple it can be brutal. At the start of a period, you have a set of customer. At the close of a period, you measure how many bucks those same customers brought in, including up- and cross-sell revenue… not including revenue from any new customer whatsoever.
People misunderstand this part. They confuse retention metrics with new sales, and cheer for growth in one without noticing decay in the other. This tool neatly splits them. Take your opening cohort revenue, add expansion, and then subtract contraction and churn. What you’re left with: did your existing business grow or shrink, all on its own?
The hero metric are expansion. When your customers consume more usage, upgrade their plans, buy more seats, etc., your net retention rise.
There is a villain lurking in plain sight. It is called contraction. It’s what occurs when your customers don’t leave entirely but do something else, like reduce usage or downgrade a plan. Churn is the straight-up loss. That’s churn.
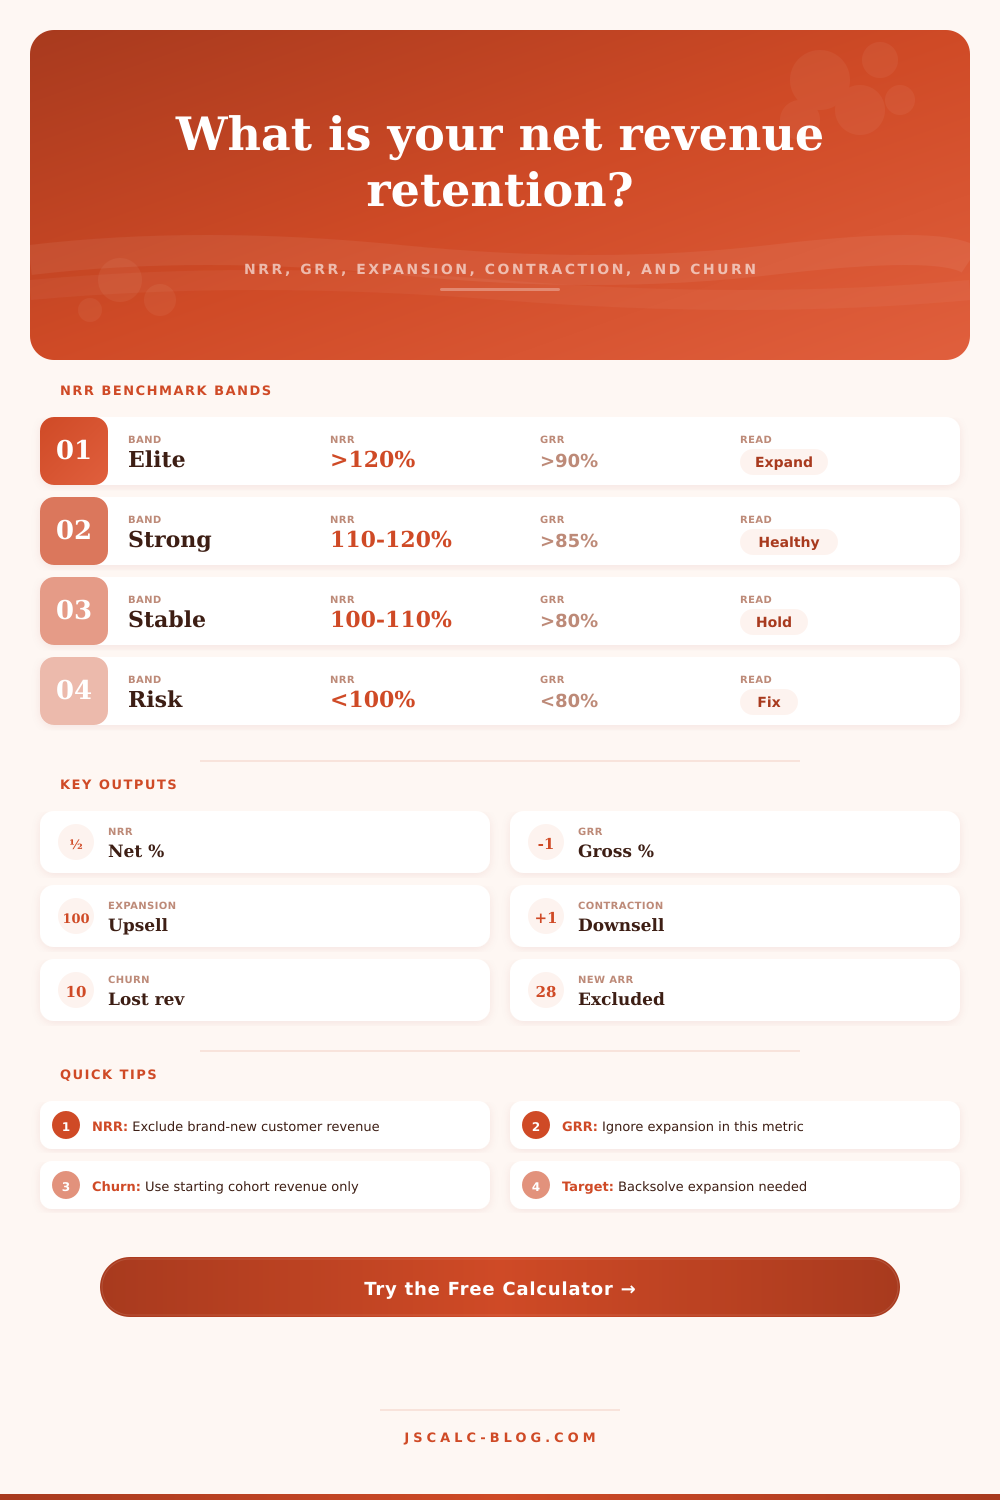
The calculator will show you the offset ratio. This shows how much expansion you’re achieving relative to the contraction (downgrade) and churn (loss). It tells you if you has enough expansion to cover everything. If the ratio is greater than 100 percent, then you’re a self-sustaining growth engine. Less than one hundred percent means you’re paying to make up for lost ground.
Additionally, check out gross revenue retention. Gross revenue retention will tell you how sticky your product realy is after accounting for all expansion. Seeing high net retention but low gross are not good. You’re essentially buying your growth via upsell instead of retaining it via a strong product.
While the reference table on the page helps break down what is healthy by segment (because an enterprise account behaves different than a small business user), note that seat growth typically drives high expansion in enterprise teams while there’s often more churn at the logo level for small business segments.
Baksolve for your target, Being able to backsolve for a target is perhaps one of the more pragmatic capabilities. Want to reach your next valuation mark? The tool will tell you precisely how much more you have to expand to get there. No longer do you guess, now you aim.
And this is important: Expansion isn’t something that happens by chance. It takes conscious efforts from Customer Success, defined upgrade paths, and product features that reward deeper usage. And don’t forget about the account retention numbers. It’s possible to get lots of big upsells and still end up with a low revenue retention rate because so many of your customers is churning out. The calculator matches those accounts against their revenue to show the full story.
Are your account numbers falling while your revenue rises? Maybe you’re too reliant on a dwindling set of customers. That is not good.
Why does this matter? Measuring these things forces you to shift from an acquisition mindset to an optimization mindset. Instead of asking “How do I acquire more customers?” you ask, “How can I serve my existing customers better?” Retention becomes a growth strategy rather than a cost center. It allows you to create a self-sustaining business that doesn’t require continuous streams of new blood.
And the secret is… knowing what you’re actualy measuring. Seeing the difference between new logos and retained value helps you understand the way forward. You begin creating something lasting instead of chasing empty numbers. This is the difference between owning value and renting attention.