Monthly Recurring Revenue Calculator
Model SaaS monthly recurring revenue from starting MRR, new subscriptions, expansion, reactivation, contraction, churn, and normalized annual contracts. The calculator reports ending MRR, ARR, net new MRR, ARPA, NRR, GRR, churn rates, and a same-rate forecast.
📌MRR Scenario Presets
🧮Recurring Revenue Inputs
This changes display labels only; it does not convert exchange rates.
Benchmark text compares your NRR, GRR, logo churn, and ARPA pattern.
Recurring revenue active at the beginning of the month.
Active accounts or subscribers at the start of the month.
New logos that began recurring subscriptions this month.
Monthly recurring value for each new customer, before annual normalization.
Annual recurring contract value signed this month, normalized into MRR.
MRR normalizes recurring contract value across the service period.
Seat growth, usage upgrades, add-ons, or plan upgrades.
Previously inactive customers returning this month.
Monthly recurring value for each returning customer.
Downgrades, seat reductions, and usage declines from retained customers.
Accounts that fully canceled during the month.
Recurring monthly value removed by each churned customer.
Temporary recurring revenue removed from the active base.
Projects ending MRR forward using this month's net growth rate.
📊Current MRR Snapshot
📐MRR Formula Breakdown
📋Preset MRR Comparison Grid
| Scenario | Start MRR | New MRR | Expansion | Lost MRR | Net New | End MRR | Likely Read |
|---|---|---|---|---|---|---|---|
| Seed SaaS month | $42,000 | $7,510 | $3,600 | $2,726 | $8,864 | $50,864 | Healthy growth, watch churn mix |
| B2B starter plans | $18,500 | $3,990 | $750 | $1,092 | $3,888 | $22,388 | New logos carry the month |
| Product-led growth | $96,000 | $16,720 | $6,800 | $5,325 | $19,515 | $115,515 | Broad volume with expansion |
| Expansion-led month | $210,000 | $9,600 | $38,000 | $12,200 | $36,600 | $246,600 | Existing accounts drive NRR |
| High churn review | $64,000 | $5,400 | $1,100 | $12,480 | -$5,260 | $58,740 | Retention problem is visible |
| Enterprise annuals | $520,000 | $87,500 | $58,000 | $36,500 | $115,000 | $635,000 | Annual contracts lift MRR |
| Agency subscriptions | $33,000 | $6,800 | $2,400 | $4,700 | $5,500 | $38,500 | Moderate growth, logo churn high |
| Creator membership | $12,800 | $3,380 | $410 | $1,594 | $2,436 | $15,236 | Small ARPA needs churn control |
| Marketplace tools | $150,000 | $21,400 | $12,500 | $10,000 | $25,300 | $175,300 | Strong balance of new and expand |
🧭SaaS Metric Reference
| Metric | Formula | Strong Signal | Caution Signal | Use In Calculator |
|---|---|---|---|---|
| Ending MRR | Start MRR + net new MRR | Positive month-over-month trend | Flat despite strong new sales | Main result card |
| Net new MRR | New + expand + reactivate - losses | Positive and repeatable | Driven only by one large deal | Growth quality check |
| ARR run rate | Ending MRR x 12 | Tracks recurring base | Includes one-time revenue by mistake | Annualized result card |
| NRR | Existing base after expand and losses / start MRR | Above 100% | Below 90% | Expansion health |
| GRR | Existing base after losses / start MRR | Above 90% | Below 80% | Retention floor |
| Logo churn | Churned customers / start customers | Low and steady | Rising in small accounts | Account retention |
| ARPA | Ending MRR / ending customers | Rises with segmentation | Falls while support load rises | Account value |
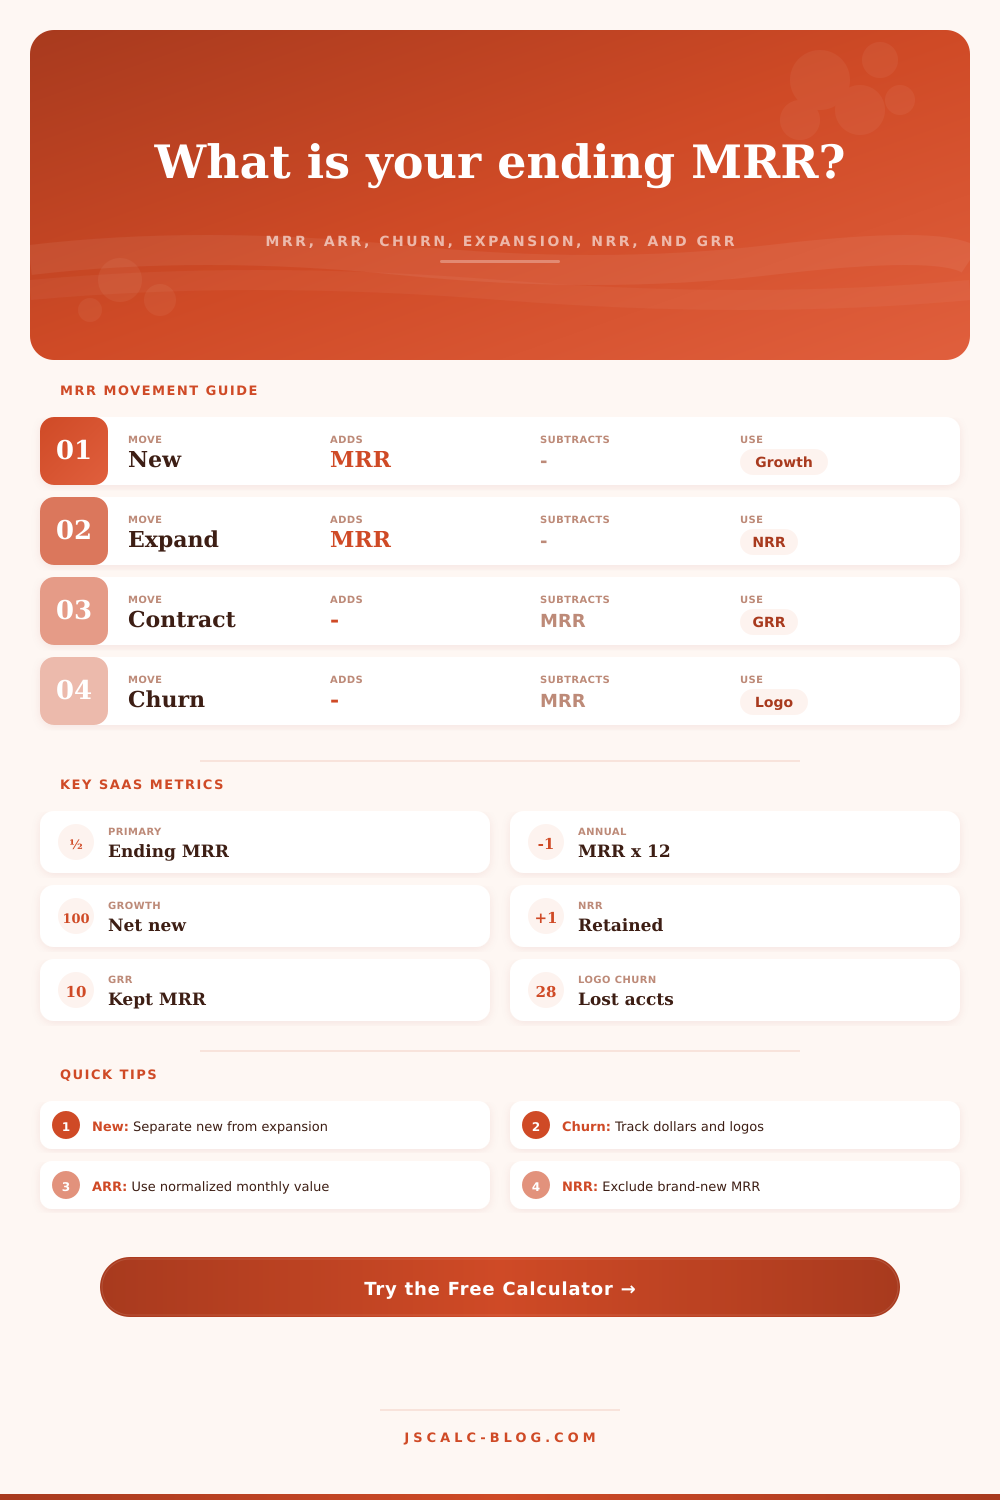
🗂MRR Movement Types
| Movement | Counts As | Example | Included In NRR | Common Mistake |
|---|---|---|---|---|
| New MRR | New recurring revenue | New account starts a monthly plan | No | Mixing new logos into NRR |
| Expansion MRR | Positive existing-account change | Upgrade, add seats, usage tier increase | Yes | Recording as new MRR |
| Reactivation MRR | Returning account revenue | Canceled account comes back | No | Hiding churn recovery in new MRR |
| Contraction MRR | Negative retained-account change | Downgrade or seat reduction | Yes | Only tracking full cancellations |
| Churned MRR | Lost recurring revenue | Customer cancels all plans | Yes | Using logo churn alone |
| Paused MRR | Suspended active revenue | Temporary billing pause | Yes | Keeping paused accounts in active MRR |
| Contract MRR | Normalized recurring value | Annual contract divided by 12 | Depends on source | Counting full ARR as one-month MRR |
🎯Motion Benchmarks Used For Notes
| SaaS Motion | NRR Target | GRR Target | Logo Churn Watch | Typical Pattern |
|---|---|---|---|---|
| Self-serve SaaS | 100% | 85% | 5% monthly | More logos, smaller ARPA |
| Product-led B2B | 105% | 88% | 4% monthly | Usage expansion matters |
| Sales-led B2B | 110% | 90% | 3% monthly | Fewer, larger accounts |
| Enterprise SaaS | 115% | 92% | 2% monthly | Expansion offsets churn |
| Agency subscription | 95% | 82% | 6% monthly | Service scope drives churn |
| Membership | 90% | 78% | 8% monthly | High volume, low ARPA |
| Marketplace subscription | 105% | 86% | 5% monthly | Activation controls retention |
💡MRR Calculation Tips
Revenue isn’t profit, and you can increase your revenue but still be losing money. That’s a common anxiety for SaaS founders, who celebrate closing new deals yet lose sight of their existing customer downgrading and cancelling in silence. Seeing just the total revenue number makes you blind to the lost income from your existing users.
MRR is a flow metric that reveals if you’re growing through customer satisfaction, or if you need to spend money replacing people who are leaving. The magic happens with numbers above, which break out expansion revenue (which means you have an existing user who likes your product so much he/she/it is willing to pay for more) vs. New customer revenue (the new customer represents both money and potential churn). By breaking this out, you will know how much of your business is acquisition and how much is retention, early stage businesses tend to focus too much on acquisition. While acquisition is expensive, retention is where the profit lies.
Real SaaS Metrics That Matter
There’s also confusion around contract normalization; this is when you have to break down big yearly contracts into their actual monthly contribution. It’s like getting $24,000 for a year-long deal. If that’s your first month, great! But otherwise you’re not going to get all those dollars at once so you divide it out in its respective months. Why? Because investors want predictability, stripping away the “signing bonus” illusion reveals the repeating truth: what are you bringing in each month? If contract structuring masks how much is coming in each month then you don’t know how to cover server costs next month, even though your check might’ve spiked last month.
The rest of the story is retention metrics. Net Revenue Retention is how well you retain customer spend with churn and expansions. Gross Revenue Retention strips out expansion completely, so it’s what you keep without selling more feature. Is your Net Revenue Retention above one hundred percent? You don’t need to sell anyone new to grow revenue, your existing base are growing by itself. Is it under ninety percent? You’re on a treadmill, you have to always hunt for new customers to tread water, let alone grow.
They’ve got a handy reference table on the page that compares various SaaS motions, and while benchmarks will differ across companies, the direction of the metrics remains the same.
The headcount equivalent of dollar churn is called logo churn (the number of accounts that left). Logo churn can look high if a startup loses twenty small accounts but keeps one big one. In this case, revenue does not drop making the situation appear healthy in practice. But losing one big enterprise client destroys your revenue, yet doesn’t budge the logo churn percentage much at all. Both measures is required: dollar churn for income; logo churn for market satisfaction. And when they differ, you’ve got a story to investigate.
How do you predict? Forecast! And what does that prediction say? Well, the tool says that given today’s momentum, it will project that same growth rate into future. Which is never necessarily the case for ever, but it’s a good starting point as to where you’ll be without any change. Too high, and you better learn how to manage expectations gently. Too low, and you know you should of got moving.
You cannot define what you cannot manage. Normalize the contracts, separate the flows, and track the retention rates. When you do, the real picture of your business will emerge, and the numbers won’t lie any longer.