Annual Recurring Revenue Calculator
Convert MRR to ARR, model new MRR, expansion, contraction, churn, retention, ARPA, and same-pace forecast ARR for SaaS planning.
All values are normalized to MRR before ARR is calculated.
Starting MRR, quarterly recurring revenue, or ARR depending on basis.
Revenue from brand-new customers in the period.
Upsells, seat growth, add-ons, or usage expansion from existing customers.
Downgrades, seat reductions, credits, or usage compression.
Recurring revenue fully lost from canceled customers.
Projects the current period's net new MRR forward for quick planning.
Used to monthly-normalize net new MRR pace for forecasting.
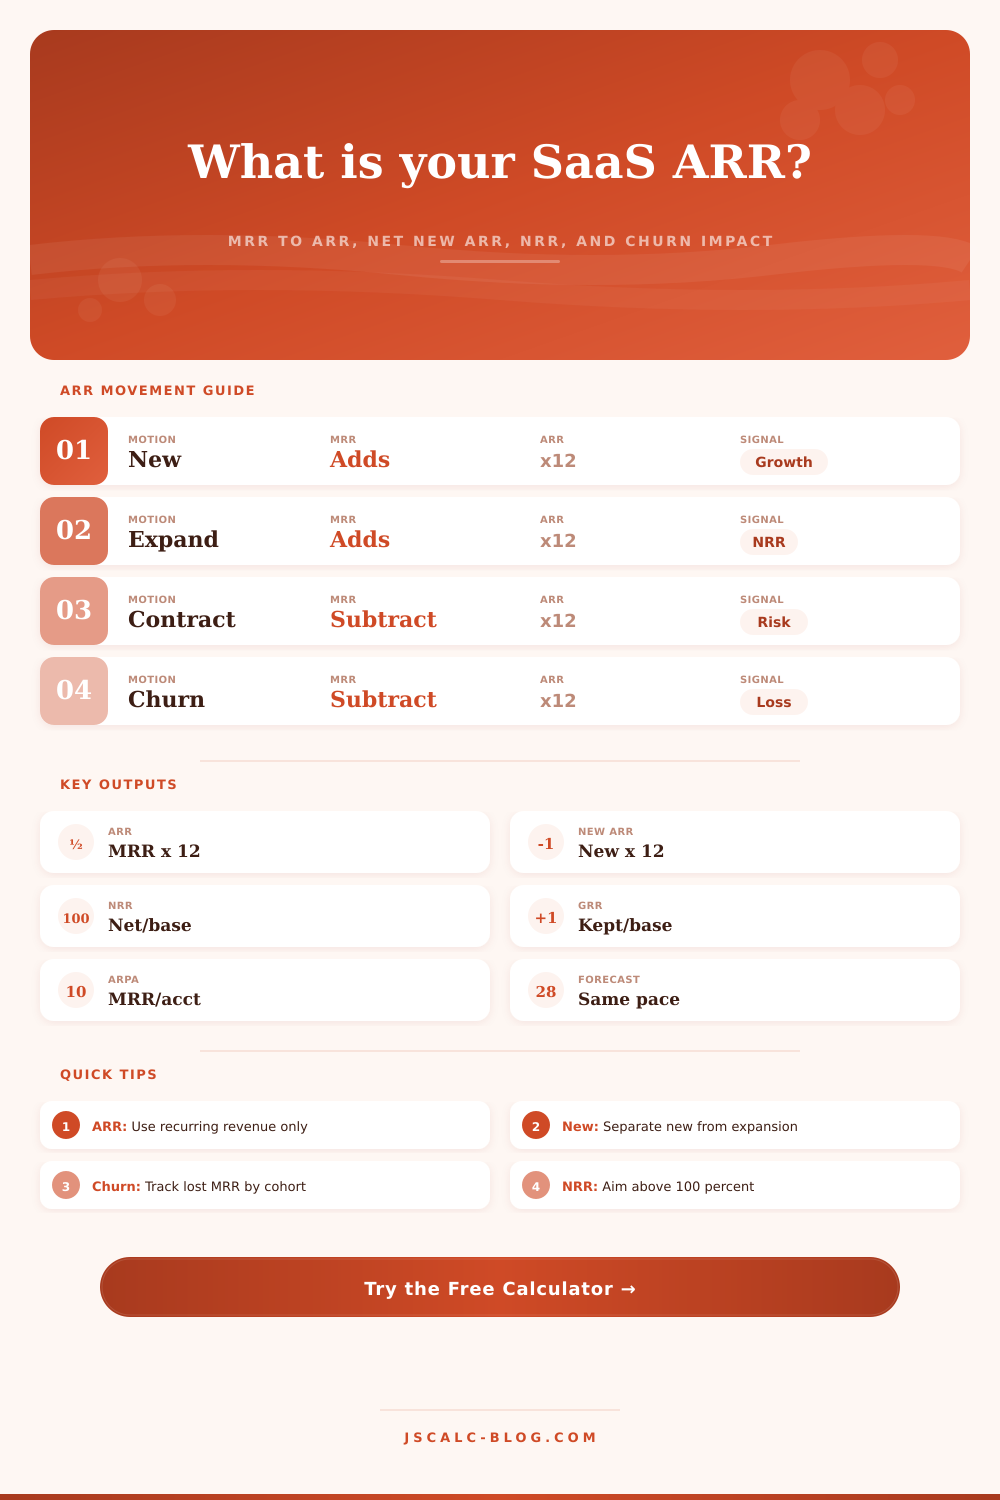
ARR = MRR x 12 is the core annual recurring revenue formula. This calculator first converts the selected revenue basis into monthly recurring revenue.
Ending MRR = Opening MRR + New MRR + Expansion MRR - Contraction MRR - Churned MRR
Net New ARR = (New MRR + Expansion MRR - Contraction MRR - Churned MRR) x 12
NRR = (Opening MRR + Expansion MRR - Contraction MRR - Churned MRR) / Opening MRR. New customer MRR is excluded from NRR so existing-account performance stays visible.
| Movement | Included In | MRR Effect | ARR Effect | Use In Retention |
|---|---|---|---|---|
| Opening MRR | Starting base | Baseline | Opening MRR x 12 | Denominator |
| New MRR | Growth from new customers | Adds to ending MRR | New MRR x 12 | Excluded from NRR |
| Expansion MRR | Existing customer growth | Adds to ending MRR | Expansion MRR x 12 | Included in NRR |
| Contraction MRR | Existing customer downgrade | Subtracts from ending MRR | Contraction MRR x 12 | Included in NRR |
| Churned MRR | Canceled customer revenue | Subtracts from ending MRR | Churned MRR x 12 | Included in NRR and GRR |
| Net New MRR | Period movement | New + expansion - losses | Net new MRR x 12 | Growth-rate input |
| Metric | Early Stage | Growth Stage | Efficient Scale | What It Means |
|---|---|---|---|---|
| Net revenue retention | 90% to 105% | 100% to 115% | 110% to 130%+ | Existing accounts can grow even before new sales |
| Gross revenue retention | 75% to 90% | 85% to 95% | 90% to 97%+ | Lower contraction and churn create a cleaner ARR base |
| Monthly revenue churn | 3% to 8% | 1.5% to 4% | Below 2% | Lost MRR that must be replaced before ARR grows |
| Expansion share | 0% to 20% | 15% to 35% | 30% to 60%+ | Portion of gross adds that comes from existing accounts |
| ARR growth signal | Proving repeatability | Scaling acquisition | Compounding retention | Compare trend by segment and cohort |
| Scenario | Opening MRR | New MRR | Expansion MRR | Loss MRR | Ending ARR | NRR |
|---|---|---|---|---|---|---|
| Lean validation | $8,000 | $2,000 | $300 | $500 | $117,600 | 97.5% |
| Self-serve traction | $25,000 | $6,000 | $1,200 | $2,200 | $360,000 | 96.0% |
| SMB growth month | $50,000 | $10,000 | $4,000 | $4,500 | $714,000 | 99.0% |
| Expansion-led | $120,000 | $18,000 | $22,000 | $9,000 | $1,812,000 | 110.8% |
| Enterprise quarter | $300,000 | $55,000 | $35,000 | $18,000 | $4,464,000 | 105.7% |
| Contraction watch | $180,000 | $12,000 | $8,000 | $24,000 | $2,112,000 | 91.1% |
| Churn recovery | $95,000 | $14,000 | $10,000 | $10,500 | $1,302,000 | 99.5% |
| Efficient scale | $750,000 | $90,000 | $120,000 | $45,000 | $10,980,000 | 110.0% |
| SaaS Motion | ARR Watchpoint | Healthy Expansion | Churn Risk | Best Review Cadence |
|---|---|---|---|---|
| Self-serve SaaS | High volume, smaller ARPA | Add-ons and plan upgrades | Inactive trial conversion cohorts | Weekly MRR, monthly ARR |
| SMB sales-assisted | Logo churn can move ARR quickly | Seat expansion and bundles | Budget resets and low adoption | Monthly |
| Mid-market B2B | Pipeline timing affects net new ARR | Department rollout | Champion loss or usage drop | Monthly plus quarterly cohort read |
| Enterprise SaaS | Large contracts make ARR lumpy | Multi-team expansion | Renewal concentration | Quarterly |
| Usage-based SaaS | Normalize volatile usage to MRR | Consumption growth | Usage compression | Monthly with rolling averages |
| Vertical SaaS | Seasonality can distort ARR | Workflow depth and add-on modules | Business closures or seasonal downgrades | Monthly, compare year over year |
Calculator reference prepared for JSCalc-Blog.com.
For SaaS founders, annual recurring revenue is number that keeps them awake at night. To compute it, you simply multiply your monthly recurring revenue by 12. But here’s the problem. The real world doesn’t work like that. Your revenue don’t grow in a straight line. It contracts, it expands, it churns.
What drives that annual number? Look under its hood. Existing accounts vs. New business: The calculator breaks out this difference. Why? Because too many team cheer as their total ARR goes up, even when they’re losing ground on retention. A gain in new sales might hide an erosion of installed base. Unless you split out churn and expansion, you fly blind. You must understand whether you’re growing because you’re keeping old customer happy, or because you’re finding new ones.
Why You Should Break Down Your ARR Numbers
Reference table shows the impact of each movement on your bottom-line number of ARR. Expansion is your secret engine. Expansion revenue happen when existing customers purchase more modules, add seats or upgrade their plan. Because you’ve already acquired these customers, this is high-margin growth: you paid acquisition cost once. That’s why net revenue retention matters so much.
Net revenue retention is a measure of how much revenue you retain from existing accounts after taking into account both churn and expansions (and contractions). If your net revenue retention exceeds 100 percent, your existing base are growing at a rate greater then its rate of shrinkage. In other words, you don’t have to sell as hard to grow.
Contraction is a silent killer. Contraction occur when your customers decrease their usage OR downgrade their plan. The customer is still technically on your books. And it’s often easier to turn a blind eye to it compared to churn. Yet these customers are bleeding value. You need to track this independently. If you do not pay attention to contraction, small inefficiencies will bleed out your margins over time.
Churn is where customers cancel, which means you lose revenue as well. High churn mean you’re forced to keep running faster and faster just to maintain the way things are.
Plugging in real numbers for your churn, contraction, expansion and new revenue allows you to model out scenarios. What if expansion jumps by 10 percent? How does that affect things? What if churn shoots up over the holiday period? How much will that affect things? And all those numbers can be normalized to a monthly or even quarterly basis so you know the true annual impact. That way you don’t get fooled into thinking there was some huge spike due to a seasonal effect or other one-off deal. It makes you focus on rate of growth, rather than raw number.
What’s the difference in different segments? Some segments has more contraction, while others have less. Some segments have higher self-serve, which has higher churn and less contraction. Enterprise deals may have less churn but much greater contraction as a deal is renegotiated downward. Figure out what your segment look like. Choose your segment in the calculator to understand how these benchmarks apply to you. That lets you set realistic expectations.
One reason early stage companies can be poor at retention is they’re still trying to figure out product market fit. A growth-stage company needs to focus on scaling acquisition. Increasing retention is key to growing efficiently. Understanding where you are helps you know where to put your efforts.
Don’t stare at the top line, break it down and understand what’s driving it. If you notice a dip in ARR, ask why. What drove that? Was it slow sales for the month? Was there churn? Was there a lack of expansion? Those answers drive your strategy. If sales are slow, check your sales process or pricing. To fix churn, fix the onboarding or product. For expansion, review your pricing or sales motion. The numbers tell a story, you just need to listen to them.
Consistency. Building something sustainable and scalable. You must know what drives your ARR. Do not make assumptions. Planning. Forecast confidently. Deploy resources wisely. This isn’t about generating higher revenues. It’s about creating better revenues. These revenues stick around, grow independently. Those are the benefits of drilling deeper than the surface.