MRR Growth Rate Calculator
Calculate net MRR growth rate, ending MRR, net revenue retention, gross retention, SaaS quick ratio, and target runway from the same monthly revenue movement.
Quarterly mode converts the measured growth rate to monthly-equivalent and annualized context.
Used for the benchmark interpretation and operating recommendation.
Recurring revenue at the beginning of the period.
MRR added by new customers, excluding one-time fees.
Upgrades, seat growth, usage growth, and cross-sell MRR from existing customers.
Downgrades, seat reductions, and usage declines from retained customers.
Recurring revenue lost from customers that cancelled during the period.
Used to estimate beginning ARPA and revenue concentration.
Used to estimate ending ARPA and customer growth.
Optional goal for calculating the implied months to target.
Formula Breakdown
| Monthly Net MRR Growth | Typical Signal | Quick Ratio Range | Retention Context | Best Next Move |
|---|---|---|---|---|
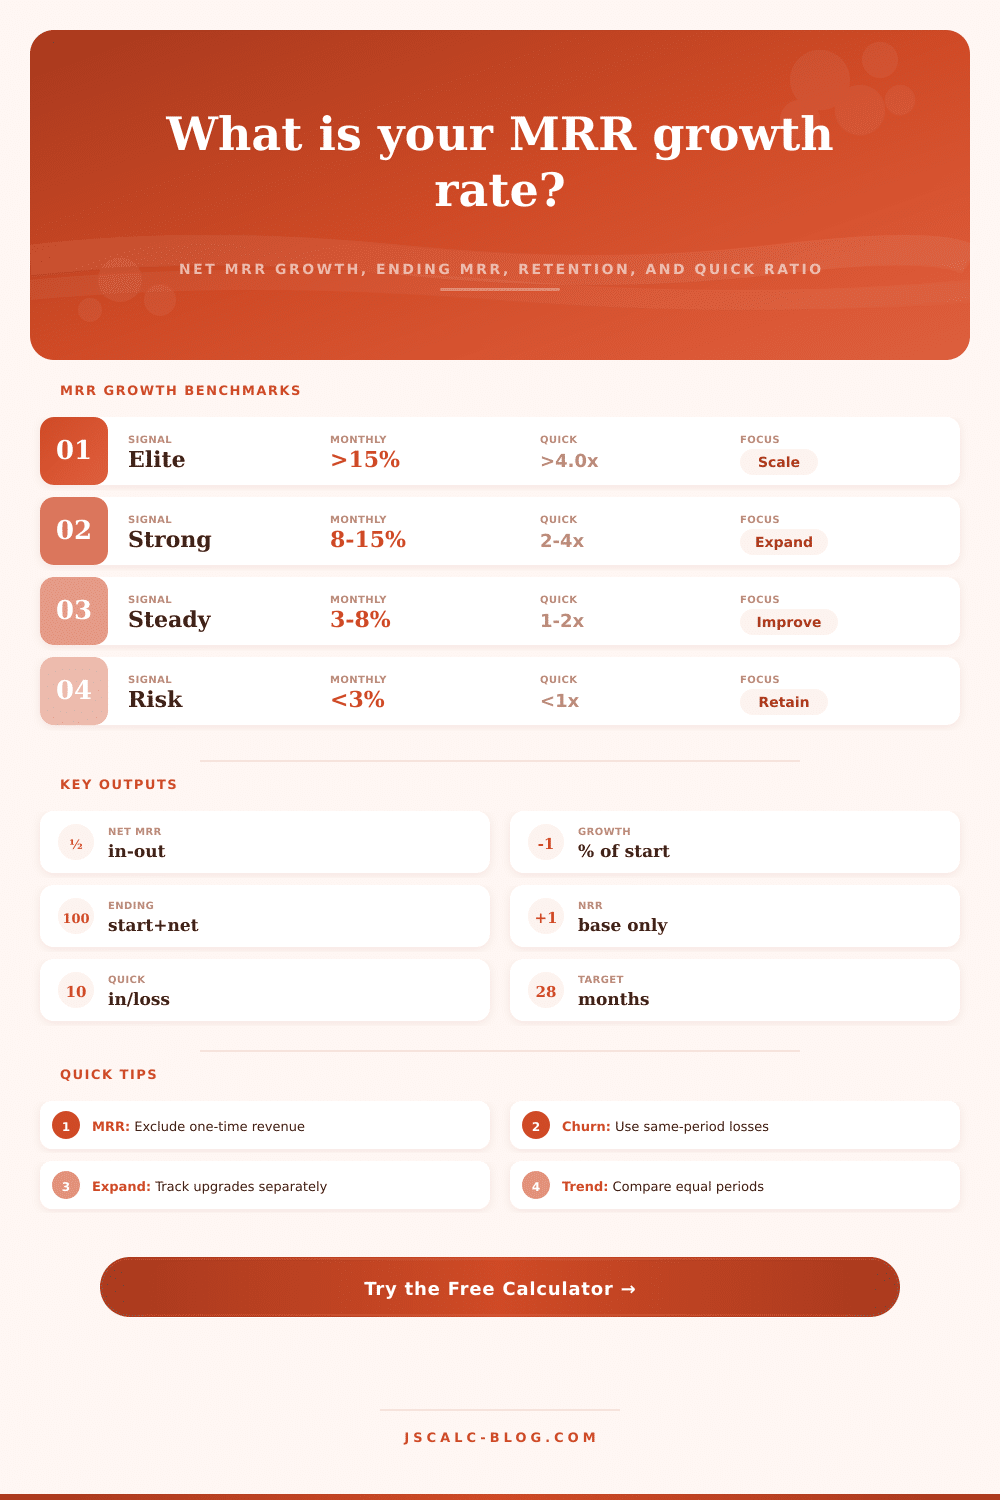
| 15% or more | Exceptional compounding | 4.0x or higher | Losses are controlled | Protect onboarding quality while scaling channels |
| 8% to 15% | Strong growth | 2.0x to 4.0x | Expansion and acquisition both matter | Double down on the highest-retention segment |
| 3% to 8% | Healthy but sensitive | 1.2x to 2.0x | Small churn shifts change the month | Improve activation and expansion triggers |
| 0% to 3% | Slow net growth | 1.0x to 1.2x | New MRR mostly replaces losses | Audit downgrade and cancellation reasons |
| Below 0% | Net contraction | Below 1.0x | Losses exceed added recurring revenue | Stabilize retention before scaling spend |
| Component | Count It When | Do Not Count | Impact On Growth |
|---|---|---|---|
| Starting MRR | Recurring revenue active at period start | Setup fees, services, one-time invoices | Denominator for growth rate |
| New MRR | A new customer begins a recurring subscription | Expansion from an existing customer | Increases net MRR |
| Expansion MRR | Existing customer upgrades, adds seats, or increases usage | Reactivations counted as new by policy | Increases net MRR and NRR |
| Contraction MRR | Existing customer downgrades but remains active | Full cancellations | Reduces net MRR and gross retention |
| Churned MRR | Customer cancels and recurring revenue ends | Temporary unpaid invoices still expected | Reduces net MRR and gross retention |
| Ending MRR | Starting MRR plus net movement | Booked but not yet recurring revenue | Base for next period |
| Pattern | New MRR | Expansion MRR | Loss Mix | Quick Ratio | Management Read |
|---|---|---|---|---|---|
| Acquisition-led launch | High | Low | Low churn, little contraction | Often 3.0x+ | Validate cohort quality before scaling volume |
| Expansion-led base | Moderate | High | Low churn, modest contraction | Often 2.0x+ | Strong customer success and account growth motion |
| Balanced growth | Moderate | Moderate | Controlled losses | 1.5x to 3.0x | Healthy if retention holds across segments |
| Flat replacement | Moderate | Low | Losses near additions | Near 1.0x | Revenue work is replacing leakage, not compounding |
| Churn leak | High | Low | High churned MRR | Below 1.5x | Acquisition may hide a weak retained revenue base |
| Contraction pressure | Moderate | Moderate | Downgrades exceed cancellations | 1.0x to 2.0x | Packaging, seats, and usage limits need attention |
| Enterprise upsell | Low | Very high | Low logo churn | Often 4.0x+ | Expansion creates growth even with slower new-logo adds |
| Seasonal downshift | Low | Low | Temporary contraction spike | Below 1.0x | Compare to the same season before changing targets |
| Metric | Formula Basis | Good Direction | Useful For |
|---|---|---|---|
| Net MRR growth rate | Net change divided by starting MRR | Higher | Core period growth |
| Ending MRR | Starting MRR plus net change | Higher | Next period opening base |
| Gross MRR retention | Starting MRR less contraction and churn | Higher | Base durability |
| Net revenue retention | Starting plus expansion less losses | Higher | Existing-account health |
| SaaS quick ratio | Added MRR divided by lost MRR | Higher | Growth efficiency pressure |
| ARPA movement | Ending ARPA less starting ARPA | Depends on strategy | Segment and pricing mix shifts |
| Monthly Net Growth | Approx. Annualized Growth | MRR Doubles In | Planning Note |
|---|---|---|---|
| 1% | 12.7% | About 70 months | Stable but slow compounding |
| 3% | 42.6% | About 24 months | Meaningful improvement if retention is clean |
| 5% | 79.6% | About 15 months | Strong recurring revenue compounding |
| 8% | 151.8% | About 9 months | Requires reliable acquisition or expansion motion |
| 10% | 213.8% | About 8 months | High-growth operating tempo |
| 15% | 435.0% | About 5 months | Watch capacity, support load, and cohort quality |
Traditionally we’re told: “Revenue is vanity; profit is sanity; cash flow is king.” But with subscription software, our rules changes: Recurring revenue behaves as though it’s compounding. For a company built on recurring subscriptions, what’s most important isn’t the dollar amount in your bank account, it’s the slope (or rate). Are you filling a leaky bucket? Or building a snowball?
Usually the answer come down to how you think about dollars exiting the business. Most founders track only their top-line revenues (and cheer when they close new contracts) without tracking those customers who recently cancelled or downgraded. That’s where growth grinds to a halt.
Understanding Your Revenue Numbers
Revenue movement is best understood by breaking it into its most basic parts. The first component is growth revenue, new customers bringing in new money which is both immediate and visible so it feels good. The second component is expansion revenue, existing customer adding seats or upgrading. This tend to be more valuable (cheaper to capture) and often more significant.
Finally, we come to the other side of the ledger. On the negative side is churned revenue, which comes from those customers who left completely and took their recurring billings with them. And then contraction revenue, which is trickier since the customer hasn’t gone away; however, through reduced usage or downgrades, they’re paying you less.
It’s very easy to lump churn and contraction together, and as such make poor hiring choices. If you lose more money through contraction (downgrades) then you do from actual churn (cancellations) you’ll never solve that problem by throwing more dollars at acquisition. You’ll need clearer value propositions and/or better packaging to retain your customers on higher tiers.
After plugging in your own specific revenue flows into the calculator above, it spits out your net MRR growth rate: The initial balance + new & expansion revenues (churn & contraction). But the growth rate itself isn’t enough. It’s only a speedometer, showing you how fast you’re moving… But not whether or not your engine will stall on you.
That’s where the quick ratio comes into play. It represents the ratio of your incoming revenue vs. It is your lost revenue. If this figure dips below one, then even though your overall revenue might be growing, you’re losing money at a faster pace. In other words, it serves as your company pressure gauge.
If you have lots of spare capacity, enough to spend on product development, or marketing, your quick ratio is higher than four. If it’s closer to one, then you’re just treading water: each drop of acquisition replaces another drop of churn.
There’s another dimension to the truth: retention metrics. How many of your customers do you retain without an upsell? Gross retention is how many customer you keep without an upsell. How many and what dollar amount do you retain after upselling? Net revenue retention.
If your net retention is high and your gross retention is low, then your product is good enough for folks to pay more to use, but bad enough that they downgrade when times are tough. This is not a great place to build from. Ideally you want them both to be high.
On top of projecting out when you’ll reach a certain MRR (based off where you’re at today), this can help plan for system or headcount requirements. Say you’re growing five percent each month. That means it’ll take you about fifteen months to double your revenue. Fifteen percent? You’ll double within five months.
Yes, that’s the speed difference, but there’s also the operational chaos of having to handle rapid growth. It’s not to say you shouldn’t use this data. In fact, I hope founders do. It would be great for all of us to see more companies being honest about their metrics. However, you have to be honest when you use this data.
If you’re fudging the churn numbers so that growth rate appears higher, savvy operators and investors will smell it immediately. Experienced operators know that we want to see the quality of the growth. We want to know whether it’s a desperate grab for new logos (the “growth” is unreliable) or whether it’s coming from legitimate expansion.
This is where the reference tables in the tool come into play: they allow you to compare yourself against industry standards. Healthy growth is slow growth in a mature market. Unhealthy growth is rapid growth accompanied by high churn. It is a time bomb.
What quadrant are you in? Do you know what the numbers is saying? Don’t take my word for it: the numbers don’t lie. But, they will mislead you if you don’t know what questions to ask them.
Know your growth story. Your revenue doesn’t just represent a number; it represents a story of how you’re treating your customers every single month. You should of checked this more carefully.