Average Revenue Per User Calculator
Calculate ARPU or ARPA from revenue, average active users or accounts, billing period, expansion, contraction, and churn inputs for JSCalc-Blog.com planning.
Use accounts when one buyer has multiple seats or users.
The calculator normalizes the result to monthly and annual values.
Include recurring, usage, and paid add-on revenue recognized in the selected period.
Currency affects labels only; formulas are the same.
Active at the start of the period, excluding inactive signups.
Active at period close. Average active base equals start plus end divided by 2.
Used to estimate revenue concentration in the existing base.
Used for active-base churn context, not for subtracting revenue.
Additional revenue from existing users or accounts during the period.
Credits, downgrades, discounts, and refunds that reduce revenue quality.
Revenue per active base
Average active base = (beginning active + ending active) / 2
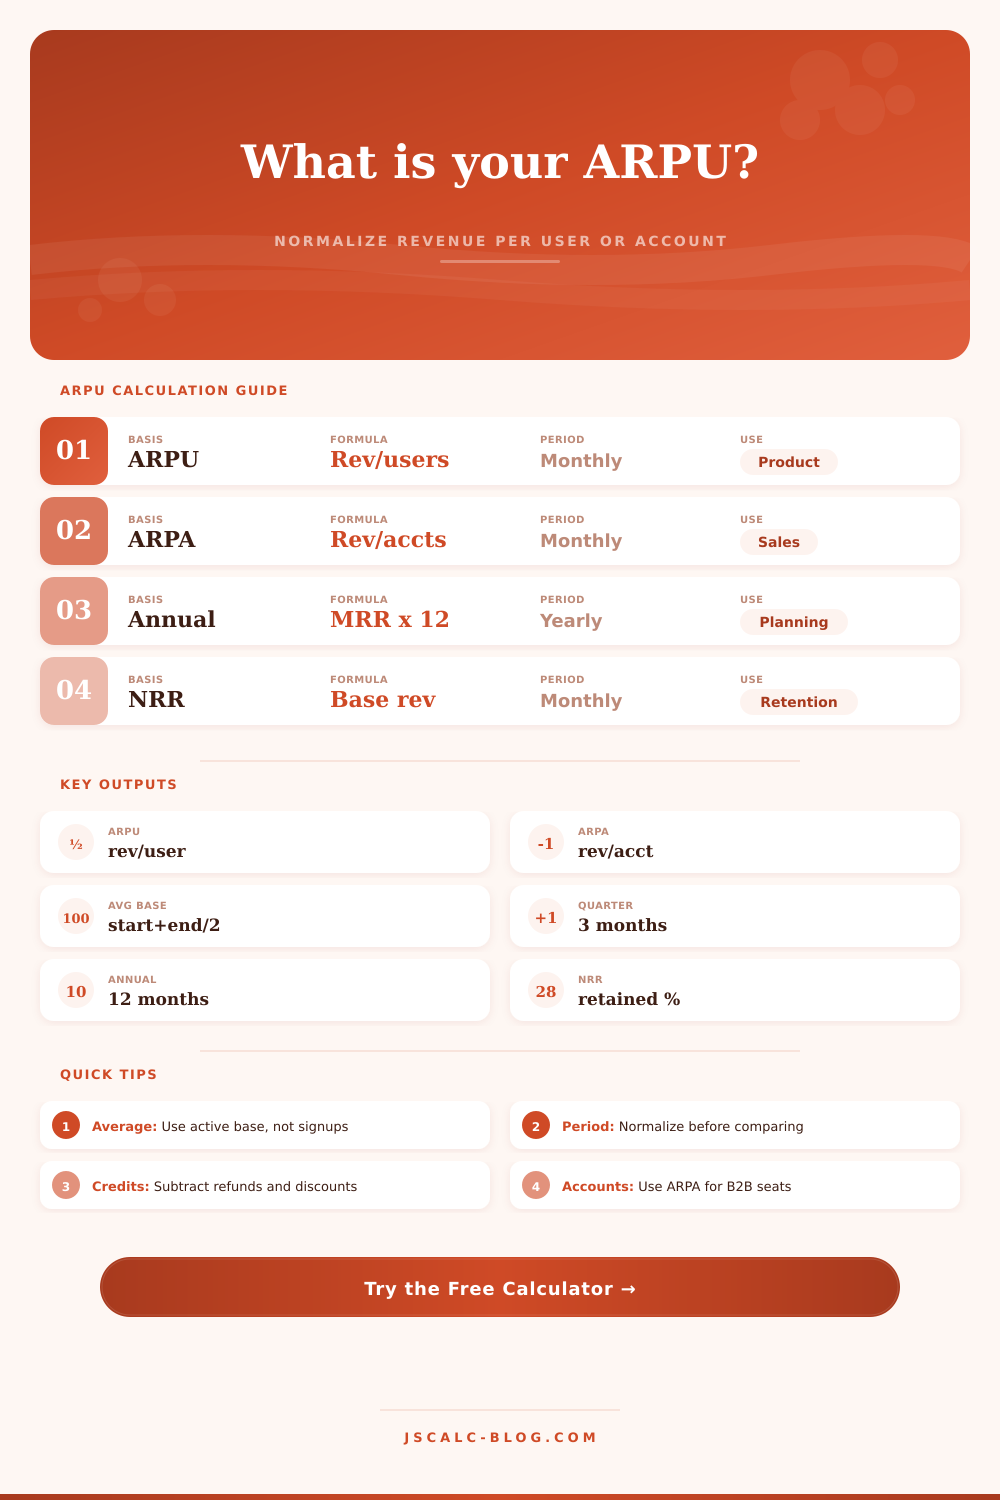
ARPU = period revenue / average active users
ARPA = period revenue / average active accounts
Monthly normalized ARPU = period ARPU / months in period
Annualized ARPU = monthly normalized ARPU x 12
| Metric | Denominator | Best for | Watch out for |
|---|---|---|---|
| ARPU | Average active users | Consumer apps, media, usage products | Inflated totals if inactive signups are included |
| ARPA | Average active accounts | B2B SaaS, agencies, team plans | Seat expansion can hide user-level weakness |
| Monthly ARPU | Monthly revenue per active base | Month-to-month trend tracking | Quarterly and annual periods must be normalized |
| Annualized ARPU | Monthly ARPU multiplied by 12 | Run-rate planning and forecasts | Seasonal products should compare same-season cohorts |
| Revenue period | Months divisor | Monthly formula | Annualized formula |
|---|---|---|---|
| Monthly revenue | 1 | Period ARPU / 1 | Monthly ARPU x 12 |
| Quarterly revenue | 3 | Period ARPU / 3 | Monthly ARPU x 12 |
| Annual revenue | 12 | Period ARPU / 12 | Monthly ARPU x 12 |
| Custom reporting note | Use exact months | Revenue / base / months | Monthly result x 12 |
| Business model | Better metric | Typical period | Active base rule | Revenue treatment | Useful companion metric |
|---|---|---|---|---|---|
| Consumer subscription app | ARPU | Monthly | Paying or meaningfully active users | Net subscription revenue after credits | Paid conversion rate |
| B2B self-serve SaaS | ARPA | Monthly | Active paying workspaces or accounts | MRR plus recurring add-ons | Logo churn rate |
| Sales-led SaaS | ARPA | Quarterly | Contracted customer accounts | Recognized recurring and usage revenue | Net revenue retention |
| Usage-based infrastructure | ARPA | Monthly | Billable accounts with usage | Usage revenue net of credits | Revenue per workload |
| Marketplace membership | ARPU | Quarterly | Active buyers, sellers, or subscribers | Fees and subscriptions, not gross merchandise volume | Take rate |
| Paid newsletter | ARPU | Monthly | Paid subscribers at start and end | Subscription revenue after refunds | Subscriber churn |
| Enterprise annual contracts | ARPA | Annual | Customer accounts under contract | Annual contract revenue recognized for period | Average contract value |
| Gaming pass or creator club | ARPU | Monthly | Active paying members | Subscriptions plus in-period add-ons | Purchase frequency |
| Signal | How to read it | Likely cause | Action to test |
|---|---|---|---|
| ARPU rising, users flat | Monetization is improving | Expansion, higher usage, or better plan mix | Check whether high-value cohorts are concentrated |
| ARPU flat, users rising | Growth is volume-led | New users resemble the existing base | Segment by channel before changing pricing |
| ARPU falling, users rising | New growth may be lower value | Discounting, free upgrades, low-usage cohorts | Compare gross ARPU and net ARPU after credits |
| ARPA rising, seats rising | Account expansion is working | Seat growth or add-on adoption | Track account-level NRR and seat utilization |
| Quality score negative | Contraction exceeds expansion | Refunds, downgrades, or retention issues | Review churned revenue and downgrade reasons |
| Annualized ARPU spikes | Run-rate may be overstated | Seasonal revenue or one-time usage surge | Use trailing three-month or same-season comparison |
The second is ARPU: the dollar value of every customer that support your business. This are the real value of your business model.
Dollar amounts is meaningless if you don’t consider how many user you have. If the number go up, your total might look great (but could indicate low revenue per customer). If it goes down, total revenue might look terrible (but could mean high revenue per user).
Why ARPU Matters for Your Business
That’s why this metric normalizes the result so you can actualy visualize what your connections is worth. The calculator above do this for you and corrects many of the pitfalls of adjusting time frames.
Make sure you’re comparing apples to apples by lining up monthly revenues with annual contract values. Finally, you need to consider which denominator you’ll use in the calculation, if you mix them up, your metric become meaningless.
Do you want to measure by user or business account? A “user” in consumer apps refer to one person. For B2B SaaS, an “account” might have several “seat.” Merging these two term results in nonsensical metrics.
If a customer represent revenue (regardless of their employees), measure by business account; this mean using ARPA. If it’s a consumer product where the value is derived from each person engaging, then ARPU are appropriate.
Depending on your business model, our reference table tell you which metric to use. Mathematically speaking, using incorrect base renders the following math suspect.
In order to get apples-to-apples comparisons, normalize your timeframes. It is very difficult to compare monthly snapshots vs. A quarterly report. Try to avoid comparing any two periods affected different than by seasonality (e.g., a spike during the holidays).
To remove seasonal distortion from your analysis, divide your quarterly revenue by three for an average per month. Then multiply this monthly average by 12 to calculate the annualized run rate. It’s a small adjustment but it makes the difference between a plan and a fantasy.
The validity of your metrics depend on the quality of your revenue. When existing customers spend more, it’s expansion. When they get refunds or downgrade, it’s contraction.
If your ARPU is high but contraction is also high, then you’re just adding new customer to replace old customers. That’s the leaky bucket effect. The revenue quality score flag this problem. A negative number mean that up-sells aren’t compensating for downgrades. You’re losing money because your product isn’t retaining value.
Turning figures into yearly totals creates seasonality distortions. A spike from one month doesn’t mean revenue will sustain. The yearly ARPU is a run rate, not a promise. It’s based off today’s trends repeating forever, usually false.
View the annualized numbers as a rough plan. View the trailing three-month numbers as reality now. The calculator give you both. You can see a snapshot of where things are at any moment and a trend line over time.
Revenue-less growth doesn’t pay the bills. Getting users isn’t enough if you can’t make money from them. ARPU forces you to respect cost of acquisition. Spending more on acquiring a user than they produce in average revenue per user mean losing money per new customer. You’re creating an army of inactive accounts instead of profitable ones. Cash flow is what matters, not the number of users.
Garbage in = garbage out. The inputs needed are value changes, active users, and revenue. Projecting and dividing is what the tool do. Your job is to be truthful with the input.
Realize that ‘total signups’ != ‘active users’. Know that ‘gross sales’ != ‘real refunds’. Feed it good stuff and the results will be better for it.
Business health can be diagnosed through ARPU. If your ARPU goes up that means your users is happy and spending more money. If it drops then that means you have diluted your userbase with lower value users. Over time monitor both ARPU and quality scores.
You want higher value users, not simply more of them. That leads to stable long term success. Should of monitored it earlier.