Subscription Payback Period Calculator
Estimate how many months it takes a subscription customer to repay acquisition spend using ARPA, gross margin, onboarding effort, churn risk, and optional expansion effects.
📌Subscription Payback Presets
🧮Payback Inputs
The math is currency-neutral; this only changes the displayed symbol.
The selected motion changes the target range and benchmark signal.
Enter ARPA as monthly recurring revenue per account after normalization.
Include marketing, sales labor, commissions, tools, and partner fees.
Average recurring revenue per account at the start of month one.
Use subscription gross margin after hosting, support delivery, and COGS.
Optional implementation labor or kickoff support added to CAC recovery.
Used for risk-adjusted payback and expected customer value.
Expansion, contraction, or usage growth from retained accounts.
Models launch discounts, ramped seats, trial conversion lag, or partial first month.
Used for the gap card and health reading.
Risk-adjusted payback sums retained contribution month by month.
📊Payback Snapshot
📋Subscription Motion Reference
🗂Payback Comparison Grid
| Subscription Motion | Typical CAC | Monthly ARPA | Gross Margin | Healthy Payback | Main Risk | Operating Focus |
|---|---|---|---|---|---|---|
| Product-led free trial | $50 to $300 | $15 to $80 | 80% to 90% | Under 6 months | Low activation | Shorten time to value |
| Self-serve SaaS | $250 to $1,500 | $50 to $250 | 75% to 88% | 6 to 12 months | Paid channel creep | Improve trial conversion |
| SMB inside sales | $1,000 to $4,000 | $150 to $600 | 70% to 85% | 9 to 15 months | Sales capacity drag | Raise close rate |
| Mid-market sales | $4,000 to $15,000 | $500 to $2,000 | 68% to 82% | 12 to 18 months | Long implementation | Reduce onboarding load |
| Enterprise contracts | $15,000+ | $2,000+ | 65% to 80% | 12 to 24 months | Delayed renewals | Win expansion early |
| Creator subscription | $10 to $120 | $5 to $30 | 80% to 95% | Under 8 months | High monthly churn | Strengthen retention hooks |
| Usage-based platform | $800 to $8,000 | $200 to $2,500 | 65% to 82% | 9 to 18 months | Volume volatility | Track cohort usage lift |
| Marketplace subscription | $300 to $3,000 | $75 to $500 | 60% to 80% | 10 to 18 months | Supply quality mix | Segment CAC by side |
📐Formula Breakdown
📈Payback Benchmark Table
| Payback Result | Efficiency Signal | Growth Implication | Common Interpretation | Next Check |
|---|---|---|---|---|
| Under 3 months | Very fast | Strong reinvestment loop | Often PLG, low-touch, or high margin | Confirm CAC attribution is complete |
| 3 to 6 months | Fast | Scale can be attractive | Healthy for self-serve plans | Watch channel saturation |
| 6 to 12 months | Good | Common SaaS target zone | Balanced acquisition and retention | Segment by channel and plan |
| 12 to 18 months | Moderate | Needs retention confidence | Acceptable for sales-led motions | Test expansion and churn assumptions |
| 18 to 24 months | Slow | Capital and cash timing matter | Usually enterprise or service-heavy | Reduce sales cycle or onboarding load |
| Above 24 months | High risk | Growth can consume cash | CAC, margin, churn, or ARPA may be misaligned | Rebuild acquisition economics |
🔍Input Quality Reference
| Input | Recommended Treatment | Include | Exclude | Why It Matters |
|---|---|---|---|---|
| Blended CAC | Use fully loaded acquisition spend / new customers | Ad spend, sales payroll, commissions, tools | Support for existing customers | Understated CAC makes payback look too fast |
| ARPA | Use recurring revenue per active account per month | Subscription MRR and committed recurring fees | Setup fees and one-time projects | Payback should reflect repeatable monthly value |
| Gross margin | Use margin after delivery cost | Hosting, support delivery, payment fees, COGS | Sales and marketing expense | Contribution margin funds CAC recovery |
| Onboarding expense | Add one-time success or implementation labor when material | Kickoff calls, migration help, implementation team | Reusable product education content | Service-heavy plans can hide a slower payback |
| Logo churn | Use same-period customer churn for the acquired cohort | Cancellations and failed renewals | New customer additions | Churn lowers expected future contribution |
| Expansion rate | Use existing-account net expansion or contraction | Seats, upgrades, add-ons, usage lift | Revenue from new customers | Expansion can materially shorten effective payback |
⚙Scenario Sensitivity Table
| Lever | Direction | Payback Effect | Example Move | Measurement Check |
|---|---|---|---|---|
| ARPA increase | Higher | Shortens payback if retention holds | Move customers to annual or team plans | Track conversion and churn by plan |
| Gross margin improvement | Higher | Every margin point raises monthly contribution | Reduce support load or cloud waste | Use contribution margin, not headline revenue |
| CAC reduction | Lower | Directly shortens base payback | Shift spend to efficient channels | Measure fully loaded CAC by source |
| Churn reduction | Lower | Improves risk-adjusted payback and LTV/CAC | Fix activation before scaling traffic | Read cohort churn, not blended churn only |
| Expansion lift | Higher | Can offset moderate churn | Add seats, usage, or upgrade paths | Separate expansion from new-logo revenue |
| Onboarding expense | Lower | Improves loaded payback | Template migration and training steps | Time customer success hours per launch |
💡Payback Operating Tips
All subscription business eventualy reach an inflection point, when they can no longer rely on magic and need to grow by arithmetic. You spend $X to get a customer, then you hope that customer will pay you back. When do they? That’s your CAC payback.
It’s how long it takes the contribution margin of a new account to offset cost of acquiring the account. If it’s too lengthy, you’re paying for your own growth out-of-pocket. That’s fine if you have lousy patience and unlimited capital. Guess what: most founders lacks those resources.
Why CAC Payback Matters for Your Business
This page’s calculator spits out a cash flow timeline that eliminate all vanity metrics. It simply requests your gross margin, average revenue per account, and blended customer acquisition cost. Then it tacks on expansion and churn.
While you may feel comfortabley entering just the visible line items (i.e., monthly fees, ad spend), this is where most models fail. Your real CAC include labor for onboarding, marketing tools, and sales commissions. Your real margin includes payment processing fees, support, and hosting. Ignore these loaded costs at your own risk; they makes your financial model shaky.
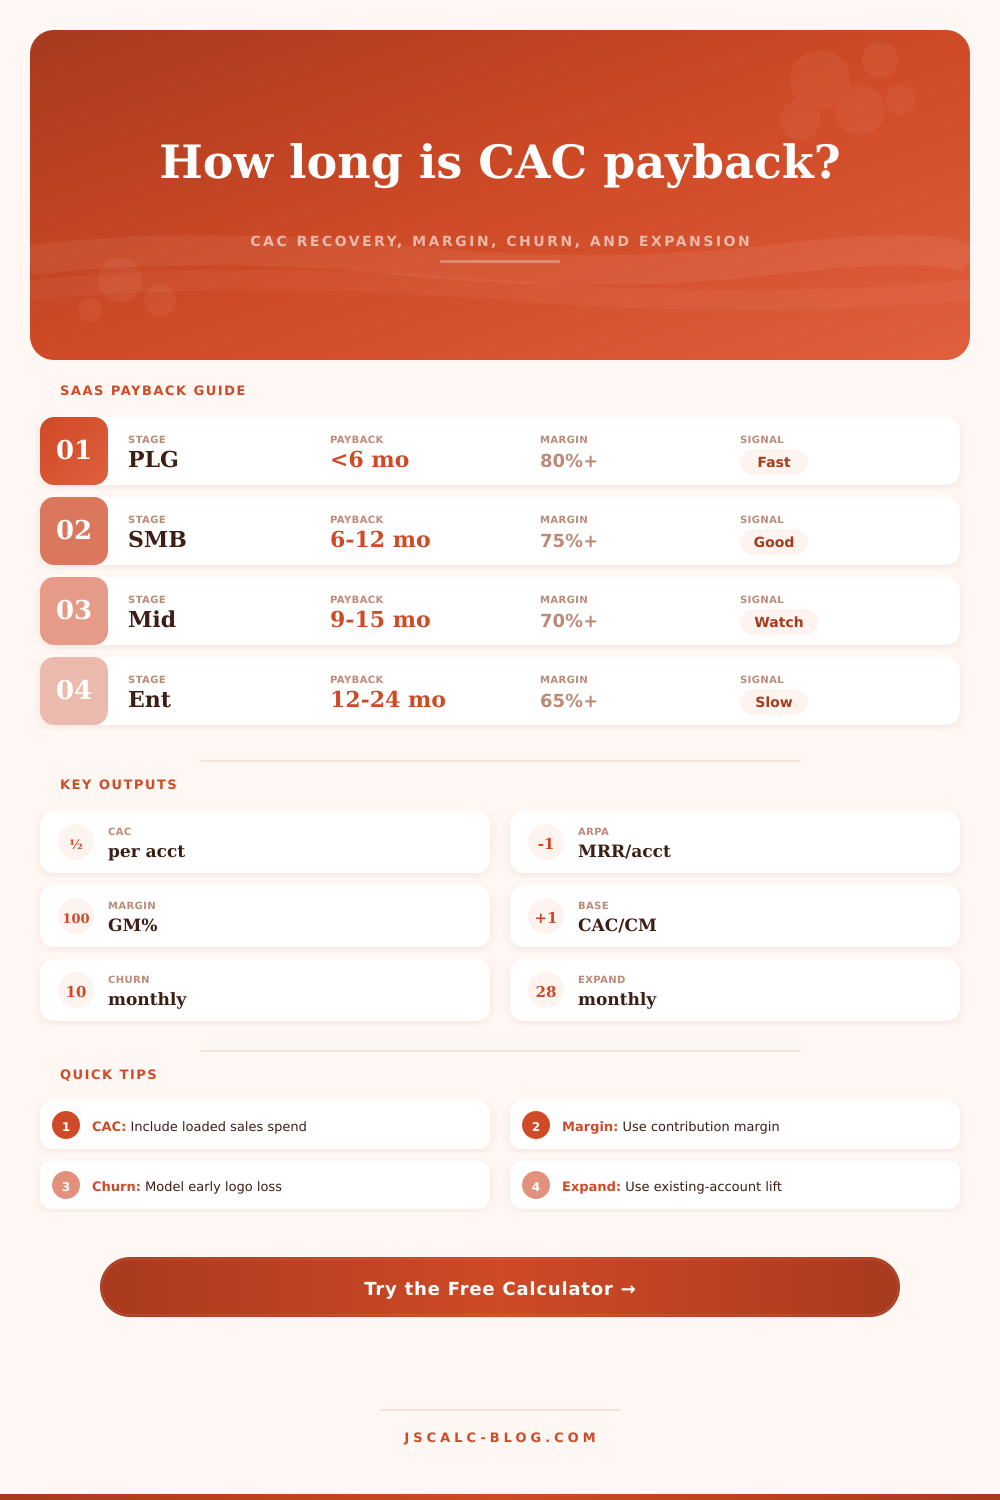
A good example is comparing a high volume, low touch, product led growth motion with an enterprise sales one. Payback may be less than 6 months vs. It takes 18+ months. While both motions can be healthy, each require a different level of risk tolerance & capital. The reference table in the tool show these benchmarks; it should of give you some idea where your particular motion falls.
Knowing you’re making money isn’t enough. You want to know when, how soon? That money comes back into your bank account to cover your next ad campaign and your next hire.
Payback periods is destroyed by churn. You spend money to acquire a customer but they leave in month three, regardless of their monthly fee, you’ll never recover the acquisition cost. That’s why the tool build up survival probability. It’s also because it factors in expansion: net revenue growth of existing accounts.
Do your customers add seats? Upgrade their plan? Those additional margin speed up the payback. That’s a powerful lever. Many teams gets so obsessed with chasing new logos that they overlook the fact that the existing base is already paying and can be made to contribute more.
That’s why I recommend treating this model as a means for stress-testing your own assumptions. What happens if churn increases by one percent? What happens if your cloud costs goes up and cause your gross margin to dip? The math can tell you precisely how long you delay breaking even. It can turn abstract concerns into concrete timelines.
Does that mean you’ll need to wait another two years? That is twenty-four months. That’s a problem, either your acquisition efficiency sucks, or your retention sucks, or your pricing sucks. There’s no scaling out of a busted unit economy.
The goal isn’t just to be profitable; it’s to be efficient. Fast payback mean reinvesting profits into growth without having to ask investors for cash. Fast payback means resilience to market changes. Slow payback make you vulnerable to every hiring freeze or rate hike.
Look closely at your inputs. Are they aspirational or realistic? The tool will tell you… It will give you the answer you deserve, not the answer you want.
Line up the numbers, stop guessing, and grow.