Customer Acquisition Cost Calculator
Calculate blended CAC, incremental paid CAC, CAC payback, LTV:CAC ratio, and channel benchmark position from marketing spend, sales allocation, new customers, attribution credit, margin, and retention inputs.
🎯CAC Scenario Presets
🧮Acquisition Inputs
Used for benchmark wording and payback interpretation.
Channel benchmarks are broad planning ranges, not promises.
Match spend and customer counts to the same window.
Choose the treatment you use consistently in reporting.
Ad platforms, sponsorship placements, and promoted listings.
Use the allocated share for this period or campaign.
Include landing pages, tracking, design, and agency retainers.
Commissions, referral credits, and channel partner payouts.
Use paying customers, not visits, trials, leads, or signups.
Percent of customers you do not count as incremental paid acquisitions.
For ecommerce, use average monthly gross revenue from a new customer cohort.
Payback uses gross margin revenue, not top-line revenue.
Use expected paying lifetime for the acquired cohort.
Only pipeline normalized mode applies this timing factor.
📌Current CAC Snapshot
📊Acquisition Model Reference
| Model | Typical Inputs | Payback Lens | Risk Check | Best CAC View |
|---|---|---|---|---|
| Product-led SaaS | Trials, content, paid search, lifecycle email | Gross margin MRR | Free-user support load | Blended plus paid CAC |
| Sales-led B2B | SDR labor, demos, outbound tools, paid search | Gross margin ARR converted monthly | Long sales cycle lag | Pipeline normalized CAC |
| Ecommerce or DTC | Paid social, search, creative, influencer fees | Contribution margin per first order and repeat orders | Promos masking margin | Incremental CAC |
| Marketplace | Supply incentives, demand ads, referrals | Take-rate margin per active account | One side subsidizing the other | Side-specific CAC |
| Local service | Search ads, booking fees, call tracking, dispatch sales | Margin per completed job | Unqualified leads | Paying-customer CAC |
| Subscription app | App ads, creator campaigns, trials, onboarding | Net subscription margin per month | Trial churn | Paid subscriber CAC |
| Enterprise ABM | Events, field marketing, sales labor, ABM tools | Margin ACV over contract life | Small cohort volatility | Account-level CAC |
🔍Channel Benchmark Ranges
| Channel | Typical CAC Range | Common Window | Spend Included | Attribution Caution | Best Use |
|---|---|---|---|---|---|
| Paid search | $50 to $300 | 30 to 90 days | Search ads, landing pages, tracking | Brand terms can over-credit paid | High-intent demand capture |
| Paid social | $25 to $250 | 7 to 60 days | Creative, media, testing, influencer boosts | View-through assumptions can inflate impact | Demand creation and retargeting |
| SEO and content | $20 to $180 | 90 to 365 days | Writers, tools, technical SEO, editing | Benefits compound after spend period | Durable acquisition base |
| Sales outbound | $300 to $2500 | 60 to 180 days | SDR labor, data, dialers, email tools | Labor allocation changes the result sharply | B2B pipeline creation |
| Affiliate or partner | $40 to $400 | 30 to 120 days | Commissions, referral credits, partner ops | Last-click can hide upstream spend | Performance-based scaling |
| Events and webinars | $250 to $3000 | 90 to 180 days | Booths, travel, production, nurture labor | Revenue may lag event date | Complex buying committees |
| Referral program | $15 to $150 | 30 to 90 days | Credits, reward ops, fraud checks | Would-have-joined customers need credit | High-trust warm acquisition |
| Account-based marketing | $1000 to $8000 | 120 to 365 days | ABM software, field spend, sales labor | Few deals make CAC lumpy | Enterprise target accounts |
⚖CAC Health Bands
| Metric | Strong | Watch | Weak | How To Read It |
|---|---|---|---|---|
| LTV:CAC | 3:1 or higher | 2:1 to 3:1 | Below 2:1 | Margin lifetime value should comfortably exceed CAC. |
| CAC payback | Under 6 months | 6 to 12 months | Over 12 months | Shorter payback frees cash for growth sooner. |
| Media share of spend | 40% to 70% | 25% to 40% | Below 25% | Very low media share may mean labor-heavy acquisition. |
| Organic credit | 0% to 20% | 20% to 40% | Over 40% | Large credit requires stronger incrementality evidence. |
| Sales cycle match | Window covers cycle | Window near cycle | Cycle far longer | Timing mismatch can understate or overstate CAC. |
| Customer denominator | Paid customers | Trial-to-paid adjusted | Leads or signups | CAC is only meaningful against paying customer counts. |
📝Preset Assumptions Table
| Preset | Model | Channel | Total Spend | Customers | Credit | ARPC | Margin | Retention |
|---|---|---|---|---|---|---|---|---|
| PLG SaaS Trial Month | Product-led SaaS | Paid search | $32,600 | 420 | 15% | $39 | 78% | 24 mo |
| B2B Demo Pipeline | Sales-led B2B | Sales outbound | $94,000 | 72 | 8% | $520 | 82% | 30 mo |
| Ecommerce Paid Social | Ecommerce or DTC | Paid social | $41,900 | 1100 | 12% | $18 | 48% | 8 mo |
| Agency Lead Gen | Local service | Paid search | $16,700 | 58 | 5% | $680 | 64% | 5 mo |
| Enterprise ABM Quarter | Enterprise ABM | Account-based marketing | $284,000 | 31 | 10% | $6200 | 78% | 36 mo |
| Marketplace Supply Push | Marketplace | Referral program | $27,900 | 380 | 18% | $28 | 70% | 14 mo |
| Mobile App Subscriber | Subscription app | Paid social | $78,500 | 2900 | 20% | $7 | 72% | 11 mo |
| Local Service Ads | Local service | Paid search | $12,450 | 96 | 7% | $190 | 55% | 4 mo |
| SEO Content Assisted | Product-led SaaS | SEO and content | $44,200 | 610 | 35% | $29 | 84% | 20 mo |
🧭Formula Method
💡CAC Calculation Tips
When customers and money are involved, people lie. Founders tell themselves this all the time, as if it were simple mathematics (it isn’t).
But here’s the problem: the result depend on who you ask for the denominator, and numerator leaves out costs hidden in the ad dashboard. Unless you factor in organic lift and hidden labor, your acq. Costs will look lower then they really are, leading to too much investment in channels that barely make a profit. Plug in your real numbers to the calculator above, and it’ll crunch the numbers for you, sparing you the need to fudge figures to suit a story.
Why Your Real Costs Are Higher Than You Think
The biggest trap is stopping at media spend. People get that wrong; most teams looks at their tabs on social or paid search and call it a day. But if you don’t include the software licenses that powered the outreach, the designer who built landing page, and the sales rep who took demo, then you’re measuring cost of the invitation, not the cost of guest. This tool separates media from tools and labor so you can measure what’s real with a combined view. And it allows you to isolate extra spend, which is vital because otherwise you only know how much your paid efforts cost after accounting for customer who would have signed up anyway.
Most don’t realize how much attribution windows matter. Conversions can appear low-cost and speedy when measured within a month’s time, but what about the slow-burn prospects that require three months’ worth of care? Extend the window to 90, to 180 days, and the c.p.a. Rise as you hold the spend for longer. Adjust this timeframe in calculator to reflect your own sales cycle. A short window will undervalue your costs if you’re selling an enterprise software product with long procurement processes; extend it too far and you’ll overvalue them if you’re selling something people buy on impulse. Only by lining up the timings to their behaviour does the data remains honest.
And then there’s issue of organic credit. All brands get some traffic through word-of-mouth, referrals or search, and no brand lives solely on paid ads. How much do you want to credit that? If you give yourself too much credit, your paid CAC will appear higher, perhaps causing you to shut down effective channels. If you give yourself too little credit, you’ll believe you’re more efficient than you actualy are. The calculator has a slider for this (typically between zero and forty percent). It’s a judgement call, but if done explicitely, it ensures you won’t accidentally double-count your own success.
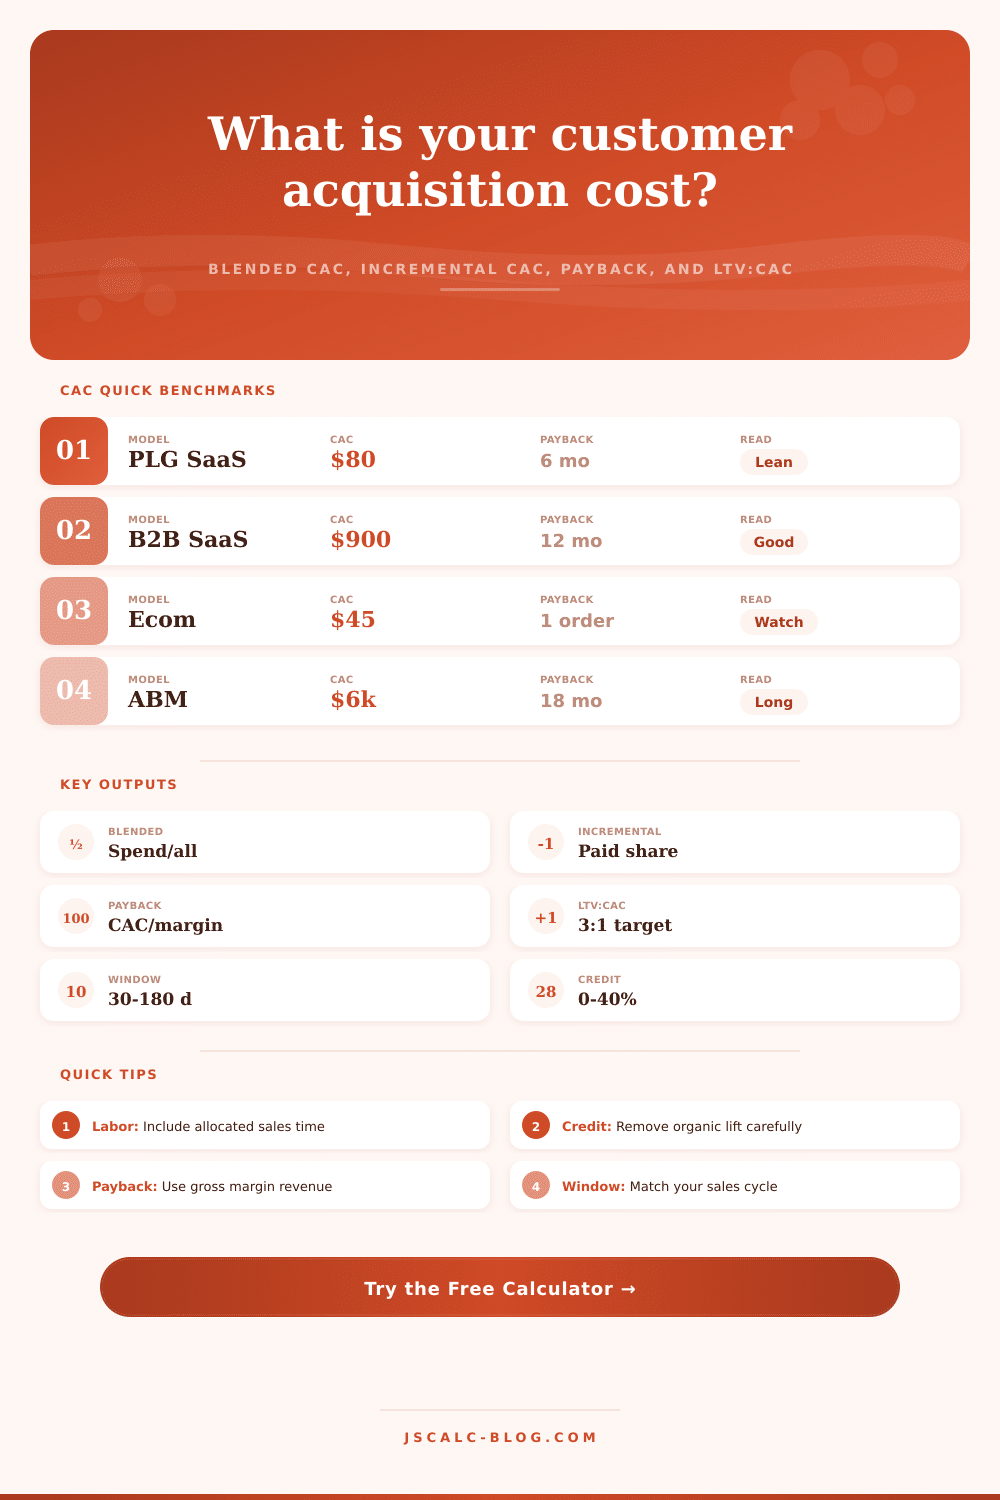
Now that we know what something costs, how much is it worth? That’s where LTV/CAC (lifetime value to acquisition cost) becomes important. For a healthy business, the average is a 3:1 ratio, which implies that for every $1 spent acquiring a customer, you’re earning $3 of margin. Anything less than 2:1 indicate you’re losing money. Anything more than 5:1 implies you may be leaving money on the table and should scale up.
It takes into account your retention months and gross margin. Why is retention so critical? You can spend a lot on a customer if they stay around for five years, but spend too little, and they’ll leave after only two month. To put numbers into perspective, the tool includes reference tables.
Because cash flow from their inventory is tight, ecommerce businesses requires quick payback (usually within six months or less). SaaS companies has more patience; they can withstand longer paybacks since that up-front risk is spread out over time while repeat revenue recurs. Understanding your model will help make sense of those numbers. What may be acceptable for an enterprise platform could be a disaster for a local service business that needs to recover its costs within 12 months. Data becomes a decision when it’s placed in context.
Customer acquisition cost is more than a number; it’s a mirror of your overall go-to-market strategy. It shows you which moves you’re making, how effectively they convert dollars into revenue and if business can grow sustainably. What gets measured gets managed. So take the time to account for organic lift, allocate labor and line up your windows. The math is basic, and that discipline is what sets the winners apart from everyone else.
You began with the spend and now you’re looking at the system. That’s where the true clarity comes from.