Cash on Cash Return Calculator
Measure the yearly pre-tax cash flow a rental returns on the actual cash you put in. Divide annual cash flow by down payment, closing costs, rehab, and points to get your true cash-on-cash yield.
🎯Real Deal Presets
📝Monthly Income & Costs
Gross scheduled rent from all units combined.
Laundry, parking, pet fees, storage.
Taxes, insurance, maintenance, management, HOA (not the loan).
Rent lost to empty months, spread evenly.
Principal and interest only; escrow lives in opex.
Used for per-unit cash-flow context.
💵Total Cash Invested
Title, escrow, lender, inspection, transfer.
Make-ready work before the first tenant.
Discount points and origination paid at closing.
Financed mode drops closing from cash invested.
🔢Formula Snapshot
📊Total Cash Invested Breakdown
| Cash Component | Amount | Share of Cash In | Paid When |
|---|---|---|---|
| Enter values above to see the cash-invested breakdown. | |||
📈Monthly Cash-Flow Worksheet
| Line Item | Monthly | Annual | Effect on Flow |
|---|---|---|---|
| The cash-flow worksheet appears after you calculate. | |||
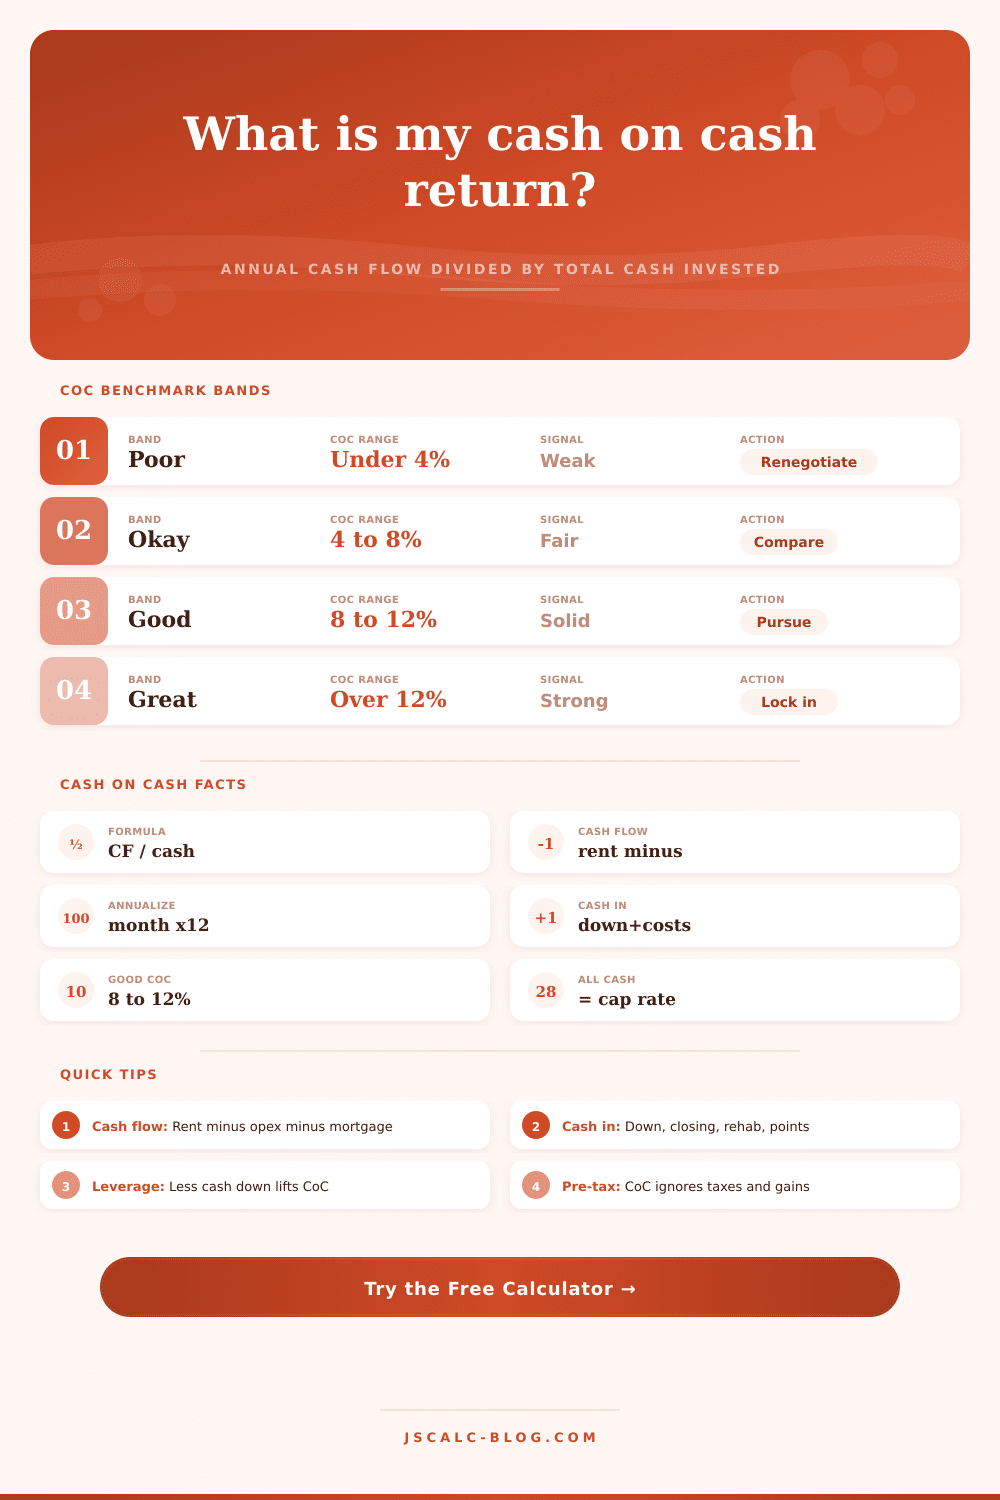
🚦CoC Benchmark Bands
| Band | CoC Range | What It Signals | Cash Flow On $80k In | Typical Move |
|---|---|---|---|---|
| Poor | Under 4% | Barely beats savings; thin margin | Under $3,200/yr | Renegotiate or pass |
| Okay | 4% to 8% | Market-average leveraged yield | $3,200 to $6,400/yr | Compare to alternatives |
| Good | 8% to 12% | Healthy buffer for surprises | $6,400 to $9,600/yr | Pursue the deal |
| Great | Over 12% | Strong leveraged performer | Over $9,600/yr | Lock in financing |
⚖Leverage Effect on CoC
| Financing | Down Payment | Cash Invested | Est. Mortgage | Monthly Flow | Annual Flow | Cash on Cash |
|---|---|---|---|---|---|---|
| Leverage scenarios appear after you calculate. | ||||||
🗂Scenario Comparison Grid
| Scenario | Rent/mo | Opex/mo | Debt/mo | Cash In | Monthly Flow | Annual Flow | Cash on Cash |
|---|---|---|---|---|---|---|---|
| $200k rental, 25% down | $1,800 | $640 | $915 | $60,000 | $245 | $2,940 | 4.9% |
| House hack (owner unit) | $2,400 | $720 | $1,650 | $16,000 | $30 | $360 | 2.3% |
| BRRRR after refi | $1,650 | $560 | $780 | $14,000 | $310 | $3,720 | 26.6% |
| All-cash purchase | $1,500 | $540 | $0 | $165,000 | $960 | $11,520 | 7.0% |
| High leverage, 10% down | $1,800 | $640 | $1,220 | $27,000 | -$60 | -$720 | -2.7% |
| Duplex, both rented | $3,000 | $1,050 | $1,320 | $78,000 | $630 | $7,560 | 9.7% |
| Short-term rental | $4,200 | $2,050 | $1,180 | $92,000 | $970 | $11,640 | 12.7% |
⚙Full Formula Breakdown
📋Input Reference Values
| Input | Common Range | Where It Fits | Effect on CoC |
|---|---|---|---|
| Operating expenses | 35% to 50% of rent | Lowers monthly cash flow | Higher opex cuts CoC |
| Vacancy allowance | 3% to 10% of rent | Trims effective rent | Higher vacancy cuts CoC |
| Mortgage payment | P&I only, escrow apart | Reduces cash flow | More leverage swings CoC |
| Down payment | 3.5% to 100% of price | Main cash invested piece | Less down often lifts CoC |
| Rehab and points | Deal specific | Adds to cash invested | More cash in cuts CoC |
💡Practical Cash on Cash Tips
Cash on cash return eliminates vanity metrics to show you how much money is actualy working for you. Here’s the formula: Annual pre-tax cash flow / Total cash you put into this deal. It could be that you find a property that looks great on paper but sucks your bank account dry each month. You see eight percent yield in the listing, the agent tells you it’s a good investment. But when you get your cash flow, you realize something else entirely. This mismatch occur because you’re confusing what ends up in your wallet with overall yield.
Once you plug in your actual numbers, the calculator does the rest. It will save you from guessing at closing costs and loan structure. You begin with income/expenses. The amount of rent per month is obvious. Next, account for vacancy. Don’t forget this! Leaving it blank assumes that you have perfect occupancy forever, this almost never occurs. Plug in an accurate percentage (maybe five percent) to account for turnover and empty months. Now, deduct operating expenses (maintenance, insurance, taxes). Lastly, subtract out the mortgage payment.
How to Calculate Cash on Cash Return
The resulting number is how much cash you collect each month. Multiply that times 12 to reach your annual numerator. Most deals goes wrong in the denominator. That’s everything below the line. These include not only the down payment, but also loan points, rehab expenses, and closing costs. Those are all hard cold cash out of your pocket up-front. If you don’t account for them, you’ll artificially increase your return percentage.
You can enter the dollar amount of these upfront costs, and select how much you financed vs. Enter how much you paid out of pocket. If you financed them, that doesn’t diminish your starting cash investment, which can increases your yield calculation. It’s a minor detail, but it helps the math match reality. This is where leverage comes into play. You’re purchasing the asset using someone else’s money, which allow you to retain a greater percentage of your own funds (free to be used as a risk buffer or otherwise). Since your annual income are divided by a lower initial investment base, the smaller down payment typically translates into a higher cash on cash return.
There’s a catch: thin margins, i.e. Low CCRs, leave you vulnerable; a single large repair bill (or an extended vacancy period) could eliminate all your gains for the year. Efficiency vs. This is about safety. The table at the top of the page show this. Anything below four percent is a sign of poor performance, whereas double digits are truly robust returns.
Cash on cash is like a speedometer, not a fuel gauge. A speedometer provides the speed at which you’re moving based off the amount of gas injected into engine, but has no information about whether that’s sufficient to get you to the next town. Cash on cash doesn’t account for appreciation (a potentially massive factor in hot markets). And it doesn’t account for principal paydown, which gradualy creates equity over time. You may be getting a three percent return on a property, but the neighborhood may be improving, with increasing rent. That could make it an excellent long-term hold. Or you may be getting a fifteen percent return on a property located in a declining area, meaning you are just being paid for taking a risk you should of avoid.
This helps you compare apples-to-apples. Run the exact same inputs on any two properties that you’re comparing. Don’t tweak the expenses or the vacancy rate so that one property appears more attractive then another. Maintain the standard. If the numbers indicates that a property is a mediocre deal, then it’s a mediocre deal. Marketing material and emotions aren’t good financial advisers. Feelings don’t matter; the math doesn’t care about them. The math only cares about the difference between cash in and cash out. Understand that and you won’t get distracted by shiny objects. You’ll begin creating real wealth.