Carrying Cost of Inventory Calculator
Calculate annual inventory carrying cost from average inventory value, capital charge, storage, service, insurance, taxes, shrinkage, damage, markdowns, and obsolescence. The results show carrying cost percentage, annual holding cost, monthly drag, target gap, and scenario comparisons.
🎯Inventory Cost Presets
🧮Inventory and Holding Cost Inputs
Use the same currency for inventory value and annual cost inputs.
Used for benchmark range and interpretation only.
Opening inventory at the start of the measured year or period.
Ending inventory at the close of the same period.
Optional. Enter 0 to use (beginning + ending) / 2.
Used to estimate inventory turns and days on hand.
Use borrowing rate, hurdle rate, or weighted opportunity cost.
Pick, slotting, variable warehouse labor, utilities, and space that scale with stock.
Rent, base warehouse staff, leases, equipment, and minimum 3PL fees.
Insurance, property tax, cycle counting, systems, and administrative service load.
Fixed inventory software, audit, security, compliance, or service contracts.
Physical loss, breakage, quality holds, theft, and count adjustments.
Slow-moving stock, expired goods, fashion markdowns, and technology aging.
Known disposal, recall, quarantine, or write-down reserves not captured by rates.
Used to quantify the gap between current holding cost and your target.
Models annual savings if average inventory falls while fixed costs stay fixed.
📊Cost Mix Snapshot
🔁Live Scenario Comparison Grid
| Scenario | Average inventory | Annual cost | Carrying cost % | Target gap | Savings vs current |
|---|---|---|---|---|---|
| Current inputs | $0 | $0 | 0.0% | $0 | $0 |
📐Formula and Method Breakdown
🧾Holding Cost Component Table
| Component | What to include | Typical input form | Best source | Common mistake |
|---|---|---|---|---|
| Capital cost | Borrowing cost, hurdle rate, cash tied in stock | Percent of average inventory | Treasury rate, WACC, credit line rate | Using zero because inventory is already paid for |
| Storage cost | Rent, space, utilities, 3PL minimums, handling labor | Percent plus fixed annual cost | Warehouse P&L, 3PL invoices, labor reports | Mixing outbound fulfillment cost into holding cost |
| Service cost | Insurance, taxes, systems, cycle counts, compliance | Percent plus fixed annual cost | Insurance policy, tax bills, inventory admin cost | Forgetting property tax or insurance on stock |
| Risk cost | Shrink, damage, spoilage, markdowns, obsolescence | Percent plus known reserve | Inventory adjustments, write-downs, aging reports | Only counting physical shrink, not slow-stock loss |
| Fixed reserve | Known disposal, quarantine, audit, or write-off programs | Annual currency amount | Finance reserve schedule | Spreading one-time cleanup across all future years |
| Inventory turns | COGS divided by average inventory | Annual COGS input | Income statement or inventory rollforward | Using sales revenue instead of COGS |
🏭Profile Benchmark Table
| Inventory profile | Common carrying cost range | Dominant driver | Inventory pattern | Review focus |
|---|---|---|---|---|
| Grocery or perishables | 14% to 28% | Spoilage and handling | Fast turns, short shelf life | Shrink, freshness, and waste |
| Retail and consumer goods | 18% to 32% | Seasonality and markdowns | Peak build before demand | Aged stock and promotional timing |
| Ecommerce fulfillment | 17% to 30% | Storage fees and velocity | SKU breadth can hide slow movers | Storage tiers and dead stock |
| Wholesale distribution | 16% to 27% | Space and capital | Broad catalog and service levels | Turns by SKU class |
| Manufacturing or WIP | 18% to 35% | Capital, WIP time, quality holds | Raw, WIP, and finished goods | Lot size and cycle time |
| Electronics or tech stock | 24% to 45% | Obsolescence | Fast aging and revision risk | Lifecycle and excess components |
| Regulated or cold chain | 22% to 42% | Compliance and storage control | Traceability, expiry, controlled conditions | Expiry, quarantine, and compliance cost |
| Maintenance spare parts | 12% to 25% | Capital tied in low-turn stock | Low demand, high service importance | Criticality vs duplicate stock |
🔧Inventory Reduction Lever Table
| Lever | Cost category affected | Math effect | Operational check | Watch-out |
|---|---|---|---|---|
| Lower safety stock | Capital, storage, risk | Reduces average inventory value | Service level and demand variability | Stockouts can erase savings |
| Improve forecast accuracy | Risk and obsolescence | Lowers slow-stock and markdown rates | Forecast bias by SKU family | A good total forecast can hide bad mix |
| Reduce order lot size | Capital and storage | Lowers cycle stock | Supplier minimums and freight breakpoints | Unit purchase cost may rise |
| Slot and consolidate space | Storage | Lowers fixed or variable storage cost | Space use, picks per hour, overflow fees | Cramped layouts can slow operations |
| Cycle count high-risk SKUs | Shrink and damage | Lowers loss rate | Adjustment rate and count accuracy | Counting effort should follow value risk |
| Earlier lifecycle exits | Obsolescence | Lowers markdown and write-down rate | Aged inventory and end-of-life dates | Liquidation timing affects margin |
📋Quick Input Source Table
| Input | Use in calculator | Best period | Alternative if unavailable |
|---|---|---|---|
| Beginning inventory | Average inventory value | Start of fiscal year or measured period | Use first month-end balance |
| Ending inventory | Average inventory value | End of fiscal year or measured period | Use last month-end balance |
| Average override | Replaces two-point average | Monthly or weekly average for seasonal stock | Rolling 13-week average |
| Annual COGS | Inventory turns and days on hand | Same year as inventory cost inputs | Annualized period COGS |
| Capital rate | Capital carrying cost | Current financing or hurdle rate | Credit line rate plus internal spread |
| Risk rates | Shrink, damage, markdown, obsolescence | Trailing year or expected planning year | Aged-stock reserve plus shrink trend |
💡Carrying Cost Tips
Inventory is an asset on your books, and most business owners see it that way. But inventory is also a ticking clock.
Each pallet waiting to be sold in your warehouse floor take money out of your pocket; before you earn a dime from it. Call this the slow leak of carrying cost.
Why Holding Inventory Costs You Money
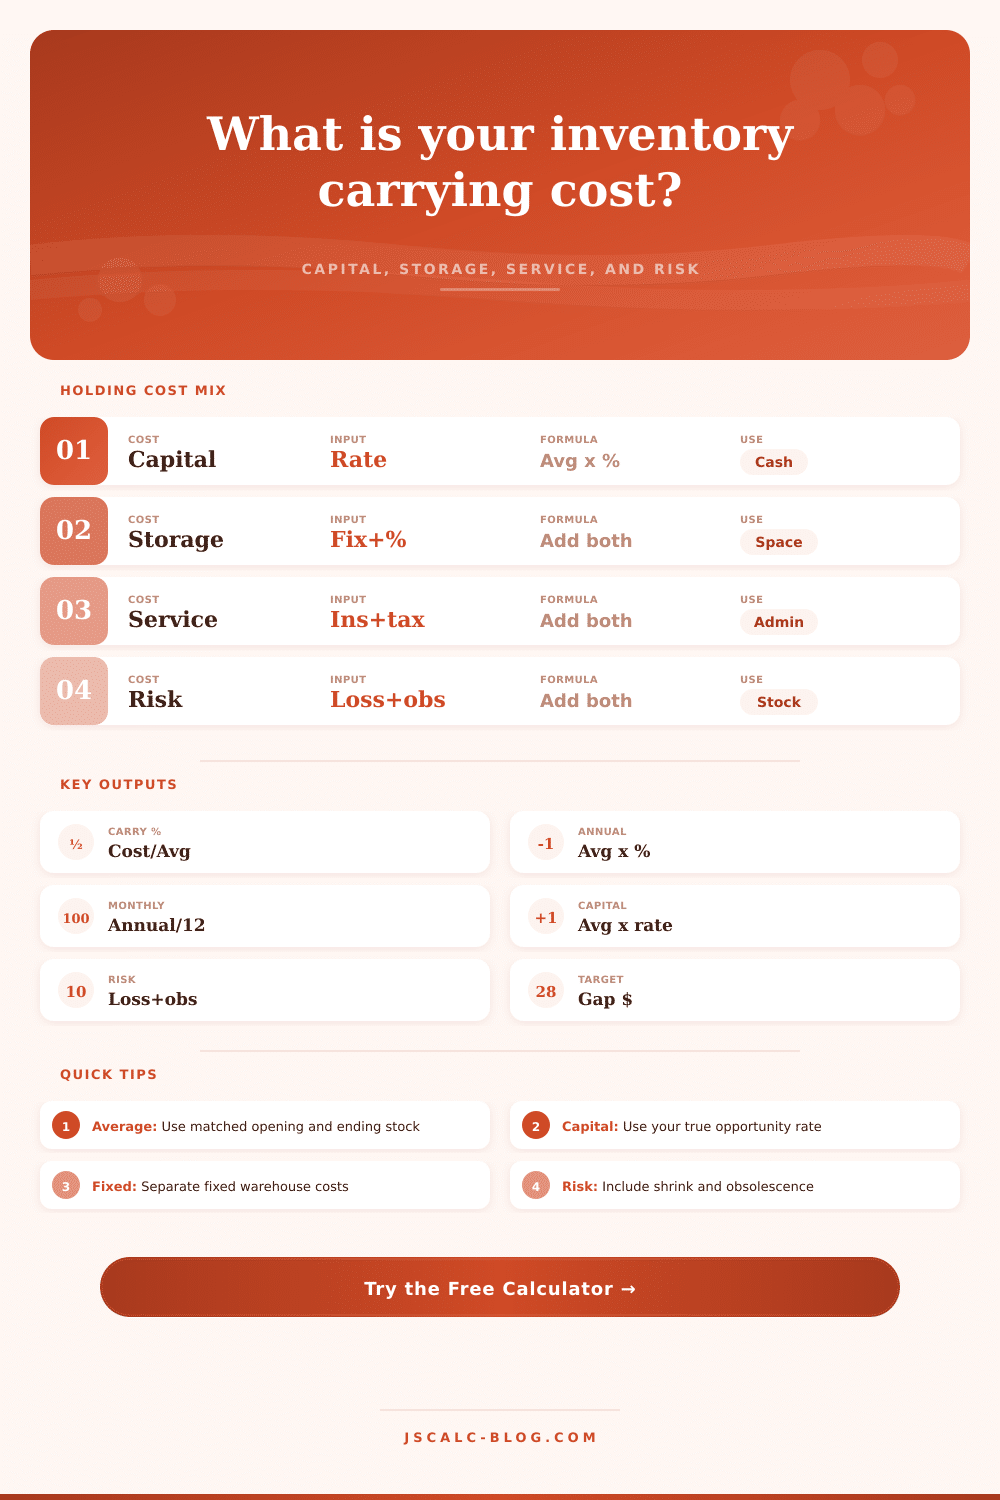
Carrying cost is more than rent of building. It’s the capital tied up in stock. It’s the insurance premiums. It’s the risk of theft. It’s the slow creep of becoming outdated.
You can’t control carrying cost if you don’t calculates carrying cost. The calculator above will do math for you. But you need to understand what those numbers mean, by looking beneath surface layers of holding stock.
Most folks are surprised by this one: its cost. I don’t mean interest on a loan. I mean capital cost, which is the money you lose by keeping each dollar in a box instead of investing it or using it to pay off a high-interest debt elsewhere. At a twelve-percent hurdle rate, you’re losing twelve cents from your pocket for every dollar of inventory you stash, every single year.
“Oh but I paid for the cash myself,” you may say. “There’s no interest cost.” Wrong. Cash has a time value and you’re paying yourself to leave it idle when it could be working for you. That’s your opportunity cost; type your true opportunity rate into the tool as an input called ‘capital rate,’ and see real expense show through.
Another trap is storage. Warehouse rent gets rolled up in a bucket called “overhead” and people don’t even pay attention to it. In fact, there’s two types of storage cost: fixed and variable.
Ten percent less inventory doesn’t mean you get ten percent off your rent, which are fixed. On the other hand, your utilities and picking labor (variable handling costs) will change along with inventory. This tool breaks out those numbers for you so you can get real. If you’re at or above your break-even point for your rent, if you have high fixed costs, then cutting inventory won’t necessarily do as much good for your bottom line as you think. This distinction help you understand why knowing your break-even points is important.
And then there’s risk, risk of shrinkage, damage and becoming outdated. That’s the good stuff that really hurts retailers. Obsolete circuit boards aren’t just unsold products; they’re total loss events. So are shirts that go out of style. You have to put rates on those in the calculator and confront the fact that some portion of your inventory will get old. Lots of companies avoids thinking about this risk until they has to write down thousands. Price that risk into your carrying cost now.
The tool lets you compare yourself with the norm through its presets. Is it normal for that sector? Is your holding cost high? How do those look different than peers? If you’re at a grocer, it’s going to be one thing; at an electronics factory another. Spoilage increases the cost of holding perishable goods. Changes in technology drive the cost of electronics. If you know what your profile looks like, then you’ll know whether you should of expect to see that much holding cost, or whether something’s leaking from the system. The page lists it out by sector to give you a quick reality check.
Now armed with the total carrying cost percentage, what do you do? Well if it’s high, then it might be time to negotiate improved payment terms from your suppliers to free up some cash. You might cut down on amount of safety stock you keep around for lower risk items. Or perhaps it’s time to sell off those slow movers while they still hold value.
Whatever it is, the tool illustrates the monthly drag, turning an abstract annual number into something urgent and immediate. It takes that curiosity in the back of your mind about what is on your balance sheet and transforms it into an operating emergency.
Ultimately, inventory is a double-edged sword: you need it to sell, but you do not want to keep it. Your objective isn’t zero inventory; your objective is correct quantity. When you quantify how much it costs to hold inventory, you’re no longer guessing. You’re optimizing.
Every single item stops being seen simply as product, and starts becoming a financial decision, one that costs you money to livig on to. This mindset is what distinguishes the great operators from the good. It turns a balance sheet curiosity into an operational emergency.