Employee Cost Calculator
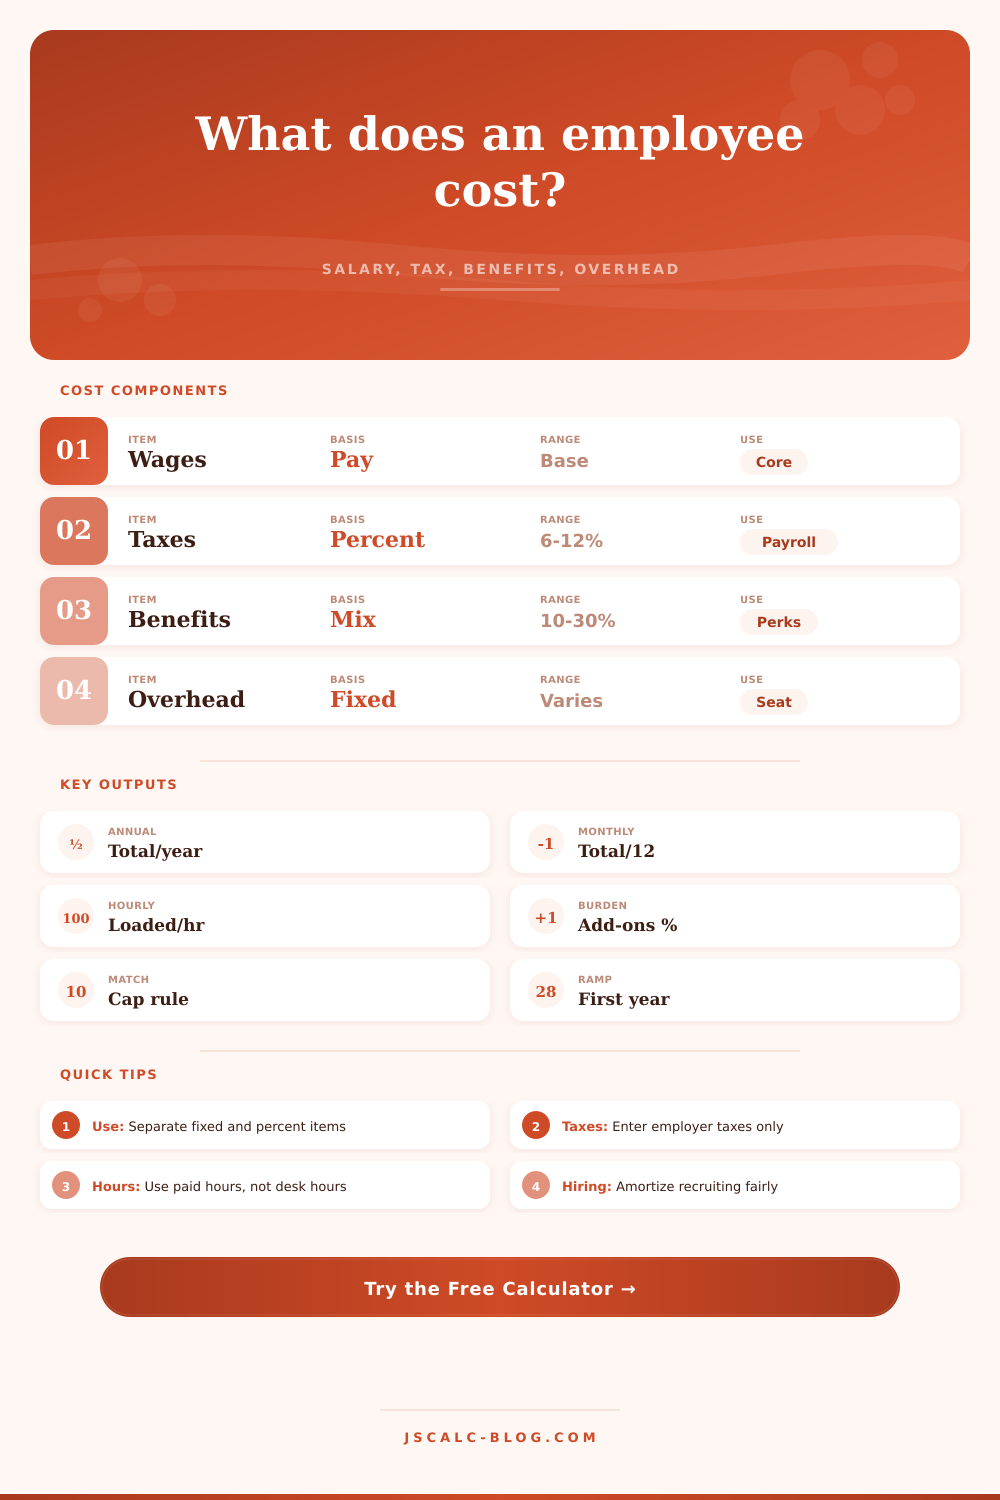
Estimate the fully loaded employee cost from salary or wages, employer payroll taxes, benefits, retirement match, insurance, equipment, overhead, training, and recruiting allocation. Results include annual, monthly, hourly, first-year, and multi-employee equivalents.
🎯Employee Cost Presets
🧮Pay, Tax, Benefit, and Overhead Inputs
Use the same currency for all annual and payroll inputs.
Used for benchmark burden range and interpretation.
Salary uses annual pay. Hourly uses wage, weekly hours, and paid weeks.
Scales total annual, monthly, and first-year organization impact.
Used when pay basis is annual salary.
Used when pay basis is hourly wage.
Include regular paid hours. For salary, this converts cost to hourly equivalents.
Use 52 for full-year employees or fewer for seasonal roles.
Employer-side payroll taxes only, not employee withholdings.
Use for PTO accrual, paid leave, stipends, wellness, and variable benefits.
Flat benefits such as HSA funding, allowances, or fixed perks.
Employer match rate applied up to the matchable pay cap below.
Example: 4% match on the first 6% of pay uses the lower percentage.
Health, dental, vision, life, disability, and employer insurance share.
Laptop, tools, licenses, phone, uniforms, and recurring seat costs.
Facilities, HR, finance, supervision, office space, and shared services.
Role-specific fixed overhead not captured by the percent field.
Annual learning, certification, onboarding labor, and ramp support.
Posting, recruiter, interview time, background checks, and signing costs.
Amortizes hiring cost across expected tenure or planning horizon.
Compares non-wage add-ons to salary or wages.
📊Cost Snapshot
🗂Employee Cost Component Table
| Component | Formula | Annual | Monthly | Hourly | Share |
|---|
🔁Annual, Monthly, and Hourly Equivalents
| Metric | Per Employee | Monthly | Weekly | Hourly |
|---|
📐Scenario Comparison Grid
🧪Sensitivity and Planning Table
| Scenario | Annual Cost | Monthly | Hourly | Burden | Difference |
|---|
📋Role Burden Reference Table
| Role profile | Typical add-on burden | Usually driven by | Watch item |
|---|---|---|---|
| Office and administrative | 25% to 45% of pay | Benefits, payroll tax, shared services | Fixed overhead per seat |
| Hourly frontline | 18% to 35% of pay | Payroll tax, scheduling, uniforms | Paid time not on shift |
| Technical or engineering | 35% to 65% of pay | Insurance, equipment, software, recruiting | Tooling and hiring allocation |
| Sales and customer-facing | 30% to 60% of pay | Payroll tax, benefits, travel, enablement | Commission and ramp period |
| Field service or mobile | 35% to 70% of pay | Vehicle, tools, insurance, training | Equipment and travel overhead |
| Part-time employee | 12% to 30% of pay | Payroll tax, scheduling, required benefits | Low hours magnify fixed costs |
| Nonprofit or grant-funded | 25% to 50% of pay | Fringe rate, compliance, shared admin | Grant-allowable allocation rules |
| Manager or senior staff | 40% to 75% of pay | Benefits, retirement, recruiting, overhead | First-year hiring and ramp cost |
🔢Formula and Method
💡Employee Cost Tips
Here’s how it works: You pay a person $72,000 per year to work for you. And you think they’re costing you $72,000. They’re not.
Because buried inside that is the weight of overhead, which manifests itself as things like software licenses and insurance premiums and payroll taxes. What most people don’t realize is that number on paycheck is merely tip of the iceberg. The rest is underwater, held up by administrative drag and other benefits that will easily increase base amount by as much as thirty to fifty percent. That’s where your small business budget gets busted.
The True Cost of Hiring an Employee
If you know your specific salary and employee cost variables (after all, you’re supposed to), plug those numbers into the calculator above and it’ll do the rest for you, no more guesswork on coefficients or forgetting which taxes applies only to employers. It breaks out fixed expenses vs. Percentage expenses (the latter being far more expensive per hour than part-time jobs typically appear on paper).
The base wage is how much you will be earning. Put that in here.
Employer side taxes depend on where you live; this will range from about nine percent, but it’s generally safe to assume between 8-10%. This includes employer-side tax.
The benefits mix includes health insurance and things like retirement matches or PTO accruals. They won’t make them optional, they cost money! But these are also part of job package you will need to get in order to compete in today’s marketplace.
The biggest thing that people gets wrong is overhead. What about the chair? The desk? Internet bandwidth? Managing the person as a job through HR?
You can specify either a fixed annual dollar amount for tools/equipment, or a percentage of pay toward shared services/tools. That’s huge, a software developer may require an expensive laptop with specialist licences, whereas an admin assistant could be fine with just a run-of-the-mill workstation. The loaded cost vary dramatically.
How do you think about recruiting? Bringing in new employees costs money. Interviewing them, posting jobs, and on-boarding them all take time and money. With the calculator you can spread out this recruiting expense across a couple of years, so it shows up more realisticaly over time (not in one year!)
What are the outputs? They provide three critical views.
The first is the total annual cost, which is the overall year-long impact. Monthly view… This can inform how you plan your cash flows.
Loaded hourly rate, That might be the most valuable measure, because it allows you to compare contractors and part-time staffers against employees. A consultant may charge $60 per hour. But an employee, all in, costs $45 per hour. At that point, it’s not a simple apples-to-apples comparison. You need to consider whether the flexibility of outside assistance outweighs the security of in-house help.
The spreadsheet includes a table of benchmarks for typical burdens across various jobs, ranging from an hourly frontline staffer to a senior manager. It can help you check your numbers. Does an admin team have a 100% burden on its salary? Something isn’t right.
To think through employee costs, you need to change your thinking. You’re not simply paying for their time. You’re paying for the support behind that time. These include compliance, training, and equipment. This adds up. The tool helps break it out for you.
And it forces you to realize that if you bring on headcount, you’ve changed your fixed cost structure forever. You can’t turn off light and save money because you hired someone. The insurance still runs. The software subscriptions still renew. The overhead stays.
Consider the full year cost of your hire as separate from first year. Recruiting and onboarding are front-loaded. That’s why the calculator clearly displays the unique first-year number, which tends to be significantly larger then the steady-state.
Cash flow! Perhaps you can afford salary, but maybe not the hiring sprint. In some cases, like long-term hires, you want to spread out the recruiting expense over 3 years. In other cases (high turnover jobs) you’d better get more aggressive about assigning that expense.
The sensitivity analysis tools allows you to adjust things like tax rate/benefits/etc. This helps you understand their impact on the bottom line. Small thing, but when you’re negotiating benefit packages/vendor contracts, it matters.
Finally, knowing the true cost of an employee helps you make better pricing decisions. To set profitable prices if you’re selling services, you need to know your internal labor rate. If you’re manufacturing goods, you need to factor this in as part of your costs per item. Otherwise, you’ll end up with thin margins, and stress. Stress happens because you don’t realize how much it all adds up.
The calculator above will run the numbers for you, but insight comes from understanding what those numbers mean. Yes, there’s the wage, but there’s so much more. It all goes toward funding the entire ecosystem that allows someone to do their job. That’s the real price of talent.