Employee Turnover Rate Calculator
Calculate total turnover, voluntary turnover, involuntary turnover, new-hire turnover, annualized turnover, retention rate, average headcount, and target gaps from one workforce period.
🎯Turnover Scenario Presets
🧮Turnover Inputs
Profile changes the benchmark read and planning comparison.
Annualized turnover scales the period rate to a 365-day pace.
Employees active at the start of the measurement period.
Employees active at the end of the same period.
Resignations, retirements, and employee-initiated exits.
Employer-initiated exits, layoffs, or terminations.
Employees hired during the period who also left during it.
Used as the denominator for new-hire turnover.
Optional focus line for hard-to-fill or high-impact roles.
Compare your period turnover with the internal target.
📊Turnover Snapshot
🗂Turnover Type Comparison Grid
| Metric | Numerator | Denominator | Current Rate | What It Shows |
|---|---|---|---|---|
| Total turnover | 0 | 0 | 0.00% | All separations from the average workforce |
| Voluntary turnover | 0 | 0 | 0.00% | Employee-initiated loss pressure |
| Involuntary turnover | 0 | 0 | 0.00% | Employer-initiated separation pressure |
| New-hire turnover | 0 | 0 | 0.00% | Early tenure loss from recent hires |
🔢Formula And Method Breakdown
📋Preset Scenario Reference
| Scenario | Profile | Days | Start | End | Vol | Inv | New-Hire Seps | Hires | Typical Read |
|---|---|---|---|---|---|---|---|---|---|
| SaaS quarterly check | Office and SaaS | 90 | 240 | 252 | 9 | 4 | 3 | 25 | Watch voluntary trend |
| Retail holiday season | Retail | 60 | 135 | 168 | 18 | 6 | 11 | 57 | Seasonal churn visible |
| Manufacturing month | Manufacturing | 30 | 420 | 416 | 7 | 5 | 2 | 18 | Stable production base |
| Healthcare quarter | Healthcare | 91 | 680 | 672 | 31 | 10 | 8 | 44 | Retention pressure |
| Call center spike | Call center | 30 | 310 | 288 | 39 | 7 | 18 | 52 | Early tenure issue |
| Startup growth sprint | Office and SaaS | 45 | 58 | 74 | 3 | 1 | 1 | 20 | Growth masks loss |
| Restaurant month | Restaurant | 30 | 86 | 91 | 12 | 3 | 7 | 24 | High operating churn |
| Warehouse peak | Warehouse | 75 | 540 | 610 | 44 | 16 | 22 | 116 | Peak staffing churn |
| Professional services year | Services | 365 | 190 | 202 | 22 | 3 | 2 | 37 | Annual talent review |
📈Benchmark Planning Table
| Workforce Profile | Common Window | Watch Zone | Solid Zone | Strong Zone |
|---|---|---|---|---|
| Office and SaaS teams | Quarter or year | Above 5% quarterly | 3% to 5% quarterly | Below 3% quarterly |
| Retail store workforce | Month or season | Above 12% monthly | 6% to 12% monthly | Below 6% monthly |
| Manufacturing and production | Month or quarter | Above 4% monthly | 2% to 4% monthly | Below 2% monthly |
| Healthcare operations | Quarter or year | Above 7% quarterly | 4% to 7% quarterly | Below 4% quarterly |
| Call center support | Month | Above 10% monthly | 6% to 10% monthly | Below 6% monthly |
| Restaurant and hospitality | Month | Above 15% monthly | 8% to 15% monthly | Below 8% monthly |
| Warehouse and logistics | Month or peak | Above 9% monthly | 5% to 9% monthly | Below 5% monthly |
| Professional services | Quarter or year | Above 4% quarterly | 2% to 4% quarterly | Below 2% quarterly |
🔍Counting Choices Table
| Counting Choice | Recommended Treatment | Why It Matters | Calculator Field | Common Check |
|---|---|---|---|---|
| Average headcount | Use start plus end divided by two | Balances growth or shrinkage during the period | Start and end headcount | Match payroll snapshot dates |
| Voluntary exits | Track separately from employer-led exits | Often points to engagement, pay, manager, or career issues | Voluntary separations | Review exit reasons |
| Involuntary exits | Keep terminations and layoffs separate | Shows performance, restructuring, or selection pressure | Involuntary separations | Compare by department |
| New-hire exits | Divide early exits by hires in the same period | Finds onboarding and selection issues quickly | New-hire separations and hires | Check 30, 60, 90 days |
| Internal transfers | Exclude from company turnover | Transfers move roles but do not leave the organization | Do not enter as separations | Report separately |
| Temporary staff | Use a separate calculation when possible | Seasonal contracts can distort permanent workforce turnover | Use a matching profile | Split temp and core teams |
💡Employee Turnover Tips
At the beginning of day, it’s spreadsheets, a full roster and a strategic plan. Before noon, two employees has resigned. Another has been fired because of poor performance. Yet another hire finds out this isn’t the role she was interviewed for. Things gets real quickly.
To quantify that chaos, you must understand what it actualy means. That number we call turnover is more than a number. It represent the pulse of an organization’s health. While most managers sees the headline percentage (and either feel good or bad), they fail to read between the lines and learn the story behind the types of separations.
Why Employee Turnover Matters
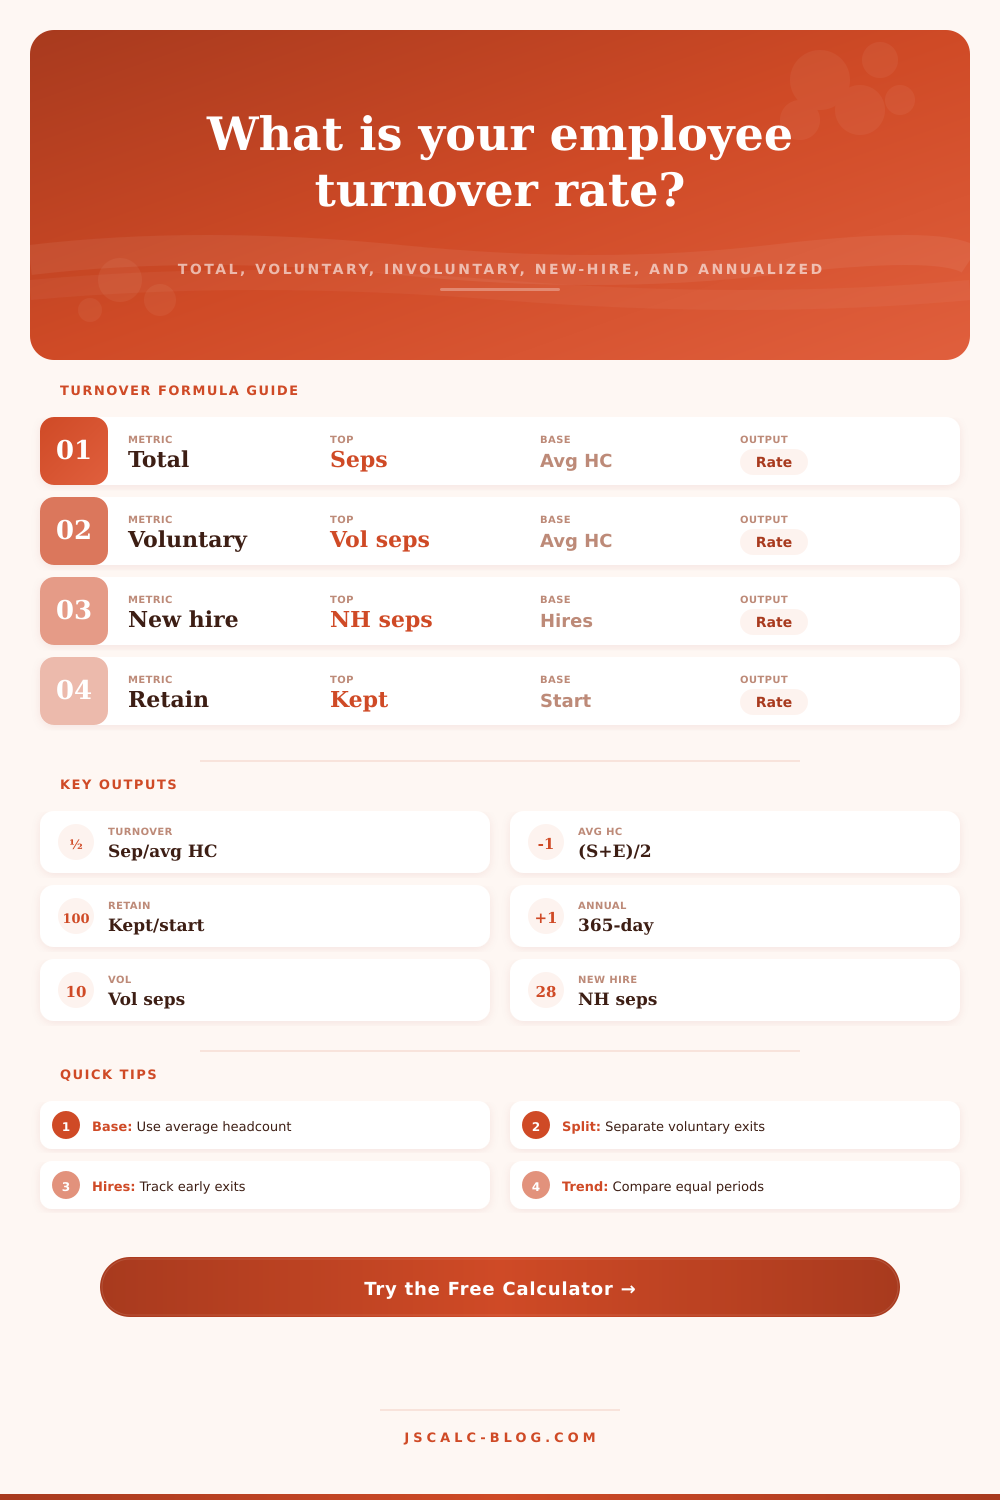
Once you’ve got those numbers on headcount plugged into the calculator (above) the rest of math gets done for you. You will no longer have to wrestle with denominator problem yourself. Because, yes: That denominator is average headcount, not ending headcount. Why does it matter? Because chances is good that your team grew or shrunk between then and now. And if you don’t take the average into account, you warp the rate. If you only see the final count, you’ll think your company has lower turnover than a growing company. This is a dangerous illusion. The tool averages in the start and end figures, smoothing that out. What you get is a baseline that shows the workload of actual people who were there.
There’s a story being told by voluntary and involuntary splits. Resignations (voluntary) point to management, pay, or engagement issues. Employer-led (involuntary) exits points to restructuring or performance gaps. You want both. Total turnover tell you nothing about how engaged your employees are if you only track that metric. Most folks miss this. The calculator will separate these for you so you can get a handle on where the pressure come from.
New-hire turnover: This is another one of those beasts. New hire is someone who joined/left in same time frame. This is a leading indicator. If you’re losing lots of people in their first year, it’s usually a sign that something wasn’t communicated well during recruiting. Your recruiting message might not have lined up with what people would be doing. Or, you didn’t get them off to a good start on day 1 during onboarding. Building a culture after a year of poor hires are more expensive than fixing your hiring process. This metric pulls out this number so you don’t have to guess whether your new talent sticks around.
The annualizing is helpful to compare against. The monthly number seems low. Sounds doable. When you annualize it, then you see what that look like on an annual basis. You see how that compounds on a monthly basis and can get lost in the day-to-day noise. Five percent monthly attrition equals a mind-blowing number on an annual basis.
What is five percent? That’s one metric, and it depends on context. For a SaaS business, that may be a great number for any given quarter. For a retail business during peak time, maybe thats terrible. The page’s reference table breaks this down by industry. By calibrating against your industry, you can know what to expect… And when something goes wrong. You aren’t competing with everyone else in your building. You are competing against yourself and the industry standard. Understanding your peer group’s “watch zone” prevents you from freaking out about normal variance, while letting you ignore a slow bleed.
The other side of that coin is retention: Who remained from initial headcount? Good retention = Stability. Poor retention = Churn. But, retention is also a double-edged sword if you don’t understand why someone left. Losing the wrong people is just as problematic than keeping the wrong ones. By breaking down how many people has separated, the calculator provides the complete picture; who has arrived, departed, and stayed with you.
But that’s when the real work begins, once the numbers appear on the screen. You know your rate. You know your split. Then what? Time to take action. Adjusting compensation? Fixing the interview process? Talking with managers who loses their teams? The data will point you in the right direction. But it won’t drive the car. That’s up to you.
You should of taken action sooner. Turnover measurement is merely the first step. Understanding it is step two. Action is what keeps the wheels turning in your business.