Car Carbon Footprint Calculator
Estimate the annual CO₂ your vehicle emits from driving using EPA fuel factors. Enter yearly mileage, fuel economy, and fuel type to see tonnes per year, CO₂ per mile, and how many trees offset it.
🚗Real Vehicle Presets
📝Driving Inputs
Typical US driver logs about 13,500 miles per year.
Combined city/highway MPG from the window sticker.
🔢Emission Factor Snapshot
⛽CO₂ Factor by Fuel Type
| Fuel | Per Gallon | Per Liter | Energy Basis | Notes |
|---|---|---|---|---|
| Gasoline | 8.887 kg | 2.31 kg | Combustion | EPA tailpipe standard |
| Diesel | 10.180 kg | 2.68 kg | Combustion | Denser fuel, more carbon |
| E10 blend | 8.20 kg | 2.13 kg | Combustion | 10% ethanol lowers factor |
| Electric (US avg) | – | – | 0.40 kg/kWh | Depends on the local grid |
| Electric (clean) | – | – | 0.05 kg/kWh | Hydro, wind, nuclear mix |
📊Annual CO₂ by Fuel Economy
| Vehicle | MPG | Gallons/yr | CO₂ kg/yr | CO₂ t/yr | Trees |
|---|---|---|---|---|---|
| Large SUV | 15 | 800 | 7,110 | 7.11 | 339 |
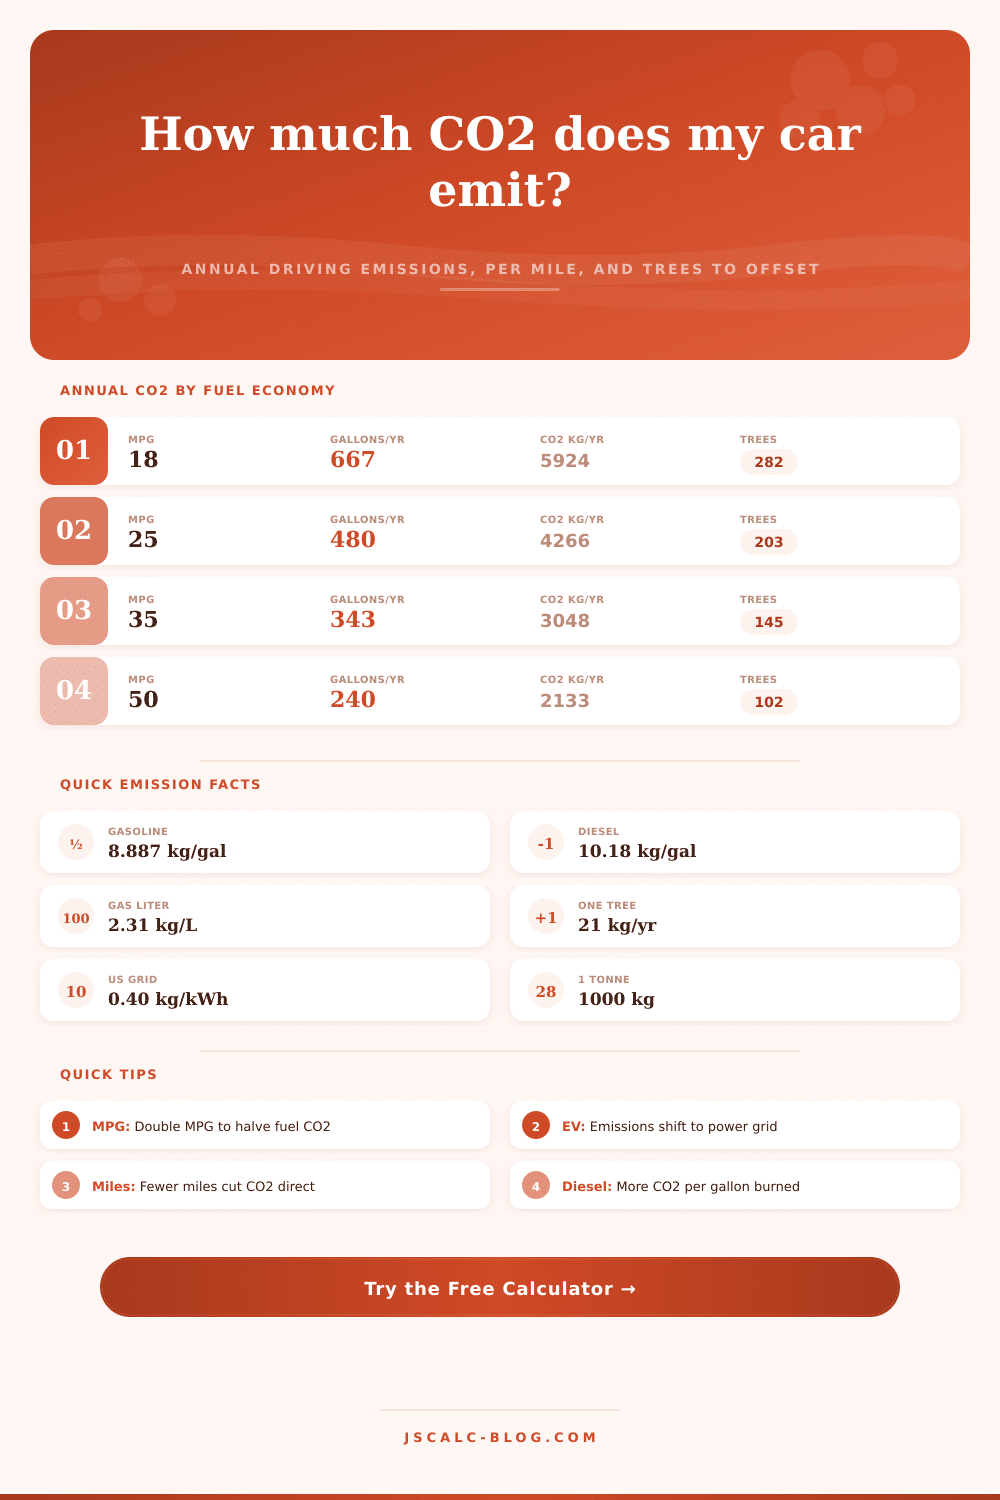
| Pickup / SUV | 18 | 667 | 5,924 | 5.92 | 282 |
| Average sedan | 25 | 480 | 4,266 | 4.27 | 203 |
| Efficient sedan | 30 | 400 | 3,555 | 3.55 | 169 |
| Compact car | 35 | 343 | 3,048 | 3.05 | 145 |
| Small hybrid | 45 | 267 | 2,370 | 2.37 | 113 |
| Top hybrid | 50 | 240 | 2,133 | 2.13 | 102 |
| Plug-in hybrid | 60 | 200 | 1,777 | 1.78 | 85 |
Based on 12,000 miles per year on gasoline (8.887 kg CO₂ per gallon) and 21 kg absorbed per tree.
🛣CO₂ Per Mile Reference
| MPG | Gasoline g/mi | Diesel g/mi | kg per 100 mi | Rating |
|---|---|---|---|---|
| 15 | 593 g | 679 g | 59.2 kg | High |
| 20 | 444 g | 509 g | 44.4 kg | Above avg |
| 25 | 355 g | 407 g | 35.5 kg | Average |
| 30 | 296 g | 339 g | 29.6 kg | Good |
| 40 | 222 g | 255 g | 22.2 kg | Low |
| 50 | 178 g | 204 g | 17.8 kg | Very low |
CO₂ per mile = fuel factor ÷ MPG. Gasoline uses 8,887 g per gallon; diesel uses 10,180 g.
🌳Offset & Equivalents
| Item | CO₂ Value | Equivalent | How It Compares |
|---|---|---|---|
| 1 mature tree | 21 kg/yr | Absorbs | Offsets ~59 miles at 25 MPG |
| 1 tonne CO₂ | 1,000 kg | ≈ 48 trees | About 2,815 miles at 25 MPG |
| 1 gallon gasoline | 8.887 kg | Burned | Needs 0.42 tree to offset |
| Average US car | 4.6 t/yr | ≈ 219 trees | EPA typical passenger vehicle |
| 12,000 mi @ 25 MPG | 4.27 t/yr | ≈ 203 trees | Baseline example in this tool |
⚙Full Formula Breakdown
📋Reference Values
| Input | Typical Range | How It Is Used | Effect On CO₂ |
|---|---|---|---|
| Annual miles | 5,000 to 20,000 | Divided by MPG | Linear: 2× miles, 2× CO₂ |
| Fuel economy | 15 to 55 MPG | Divides the miles | Higher MPG lowers CO₂ |
| Gasoline factor | 8.887 kg/gal | Multiplies gallons | Fixed EPA constant |
| Diesel factor | 10.18 kg/gal | Multiplies gallons | ~15% more per gallon |
| Grid factor (EV) | 0.05 to 0.60 | Multiplies kWh | Cleaner grid, less CO₂ |
| Tree absorption | 18 to 25 kg/yr | Divides total CO₂ | Sets trees needed to offset |
💡Practical Emission Tips
The odometer never lies, but it rarely tell the whole story about your environmental impact. Most people think that if they trade their gas guzzler for an eco-friendly mid-size sedan, they’re now eco-warrior material. Seems logical. Less gas = less pollution = more Earth-saving. Unfortunately, things aren’t quite as simple as that: Carbon output isn’t solely based off the size of your ride.
Knowing which other factors comes into play will help you make better choices different than simply purchasing a smaller set of wheels and crossing your fingers.
More Than Just Your Car Size
First things first: What’s your actual driving distance? After plugging that figure into the calculator here (which do all the math for you), there’ll be no need to guess if your commute is unusually long or short. Because we mentally account only as far as our own office parking lot, most of us underestimate how much we drive. We forget about all the little errands on the weekends, like taking kids to school or making the occasional stop at Home Depot. Once you input a realistic number, what pops up is your actual footprint, not an idealized picture of your week. And that counts, since cutting 50 miles from your weekly driving will reduce your emissions much more than saving a single mile’s worth of fuel.
The second major lever is fuel economy. Fifteen-mile-per-gallon vehicles burns far more gas than those achieving twenty-five mpg (or better). It’s not just a question of dollars spent at the gas pump; it also means kilos of carbon dioxide emitted into our atmosphere with each tankful. Double the fuel economy and you effectively cut the emissions in half…for the same mileage. That’s an impressive mechanical advantage.
But too many people buy based on hybrid badging without considering how much energy their vehicle consume. Because batteries weigh so much, a heavy hybrid may actually consumes more energy per mile than a lightweight conventional vehicle. Physics is what matters, not moddern marketing labels.
Even this alters the equation depending on what kind of fuel you use. Gasoline burns lighter hydrocarbons, which means it has less carbon per gallon. In contrast, diesel engines runs with high thermal efficiency by burning a dense liquid. Meaning, if you trade up to diesel and don’t see an improvement in miles per gallon, you could end up emitting more overall. The comparison table on the page show how the different emission factors for each fuel compare side-by-side. You can see how the actual chemistry of the fuel determine the initial emissions before the engine has turned over. Knowing the chemistry behind it all helps avoid the expensive pitfalls of fuel switching and vehicle upgrades.
Finally, there’s the complication of electric vehicles, which push emissions out of your tailpipe and onto the power grid. No more exhaust, so it seems environmentally friendly, but the electricity you’re using to charge your car probably originated at some distant power plant. Depending on location, this electricity can be incredibly dirty or very clean. If your area relies on coal for power, its electricity will be far dirtier then if you live in a region with lots of nuclear or wind energy. To determine how environmentally costly it is to plug in, you must consider your local grid factor. Without accounting for this variable, we paint too rosy a portrait of electric cars.
These are abstract figures, and one visceral example that makes them real is tree planting, the idea being that mature trees will absorb certain levels of carbon each year, providing a kind of naturaly check against fossil fuel burning. It doesn’t remove all the harm immediately, but at least it offers a clear goal of balance. The trade-off is straightforward: driving more efficient or driving fewer miles means there is less need to make up for it by planting a forest. (A big pickup truck requires a forest; this illustrates the fundamental point that “an ounce of prevention is worth a pound of cure.”)
In the end it’s all about distance and efficiency, getting more efficient while traveling less distance. There is no silver bullet solution, but pairing sensible driving behaviors with intelligent vehicle selection can make a big difference. You should of known this! It isn’t about being perfect, but rather understanding that every mile has a price tag in environmental currency. When those figures becomes clear, the road ahead is far simpler to navigate.