Product Carbon Footprint Calculator
Estimate a product's cradle-to-gate lifecycle CO₂ from raw materials, manufacturing energy, and freight transport. See total kg CO₂e, a per-unit figure, and a full breakdown by stage.
🌍Real Product Presets
📝Product Lifecycle Inputs
Mass of raw material in one finished product.
Auto-fills from material; edit for recycled content.
World avg ~0.40; renewables lower, coal higher.
Totals scale to the batch; cards show per unit.
🔢Formula Snapshot
🧪Material Emission Factors
| Material | kg CO2e / kg | Category | Recycled Option | Notes |
|---|---|---|---|---|
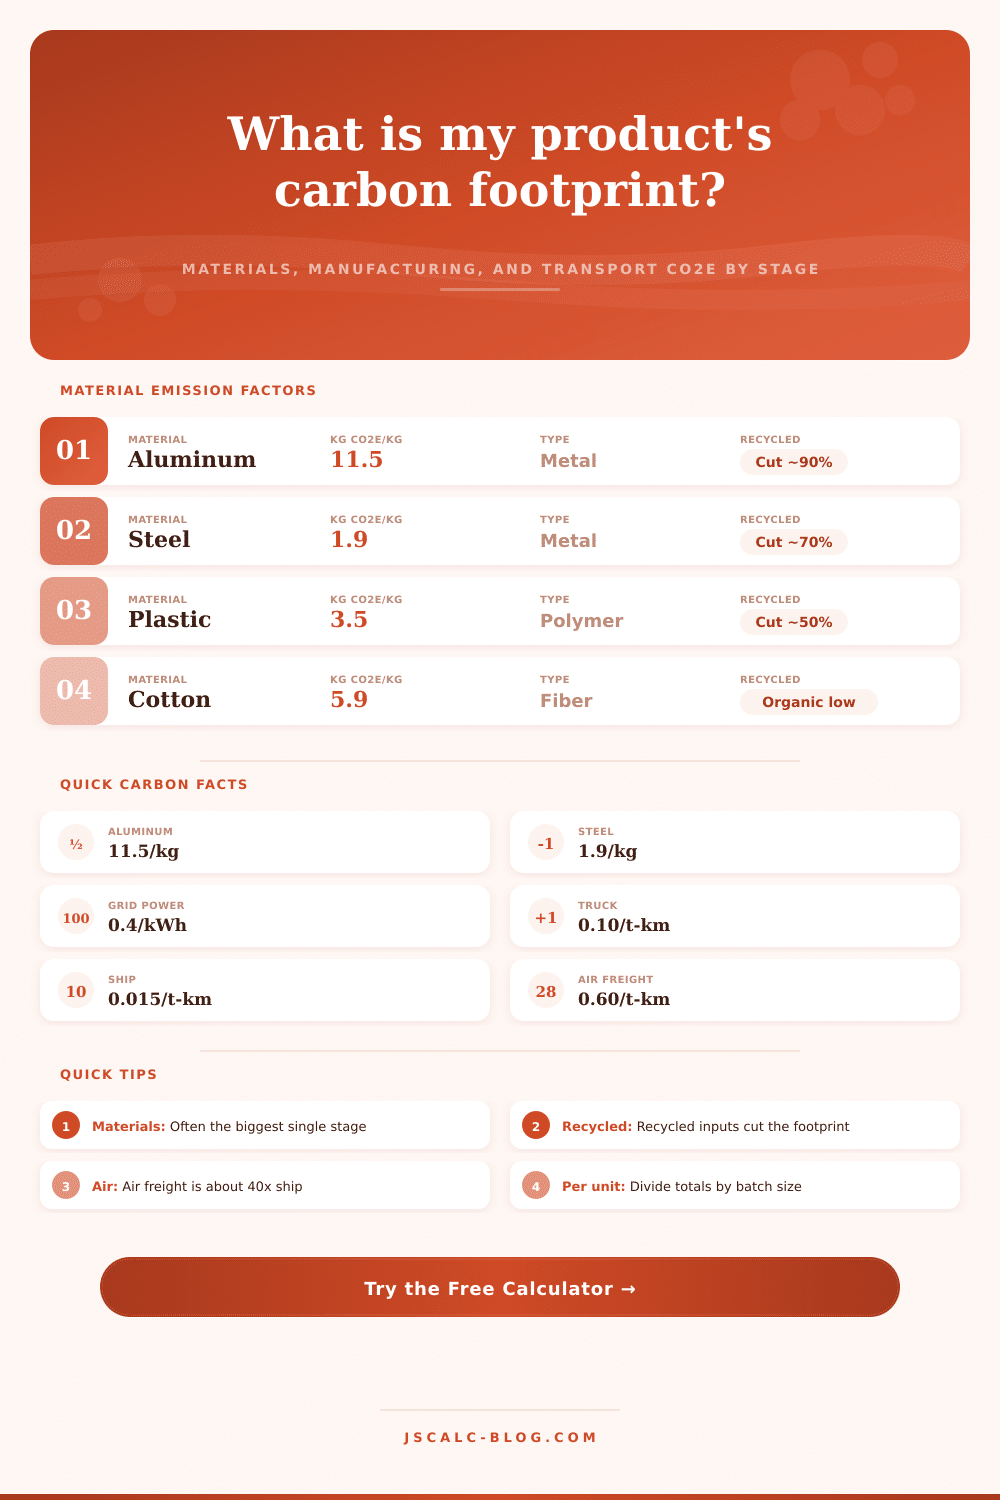
| Aluminum (virgin) | 11.5 | Metal | Recycled ~1.2 | Very energy-intensive smelting |
| Cotton | 5.9 | Natural fiber | Organic lower | Water and land heavy |
| Virgin plastic (PET) | 3.5 | Polymer | rPET ~1.8 | From fossil feedstock |
| Steel | 1.9 | Metal | Recycled ~0.6 | Scrap-based EAF cuts sharply |
| Paper / cardboard | 1.1 | Fiber | Recycled ~0.7 | Recycled pulp helps |
| Glass | 0.85 | Mineral | Cullet ~0.6 | Heavy but low per kg |
| Concrete | 0.13 | Mineral | SCM blends lower | Low per kg, high total mass |
🚚Transport Mode Factors
| Mode | kg CO2e / tonne-km | Speed | Best For | Relative |
|---|---|---|---|---|
| Air freight | 0.60 | Fastest | Urgent, light, high value | ~40× ship |
| Truck / road | 0.10 | Flexible | Regional door-to-door | ~7× ship |
| Rail freight | 0.028 | Moderate | Bulk overland | ~2× ship |
| Ocean ship | 0.015 | Slowest | Bulk long-haul imports | Baseline |
🗂Per-Kg Comparison Grid
| Material | Factor | CO2 for 1 kg | + 1000 km Truck | + 5000 km Ship | Total (truck) |
|---|---|---|---|---|---|
| Aluminum | 11.5 | 11.50 kg | +0.10 kg | +0.075 kg | 11.60 kg |
| Cotton | 5.9 | 5.90 kg | +0.10 kg | +0.075 kg | 6.00 kg |
| Virgin plastic | 3.5 | 3.50 kg | +0.10 kg | +0.075 kg | 3.60 kg |
| Steel | 1.9 | 1.90 kg | +0.10 kg | +0.075 kg | 2.00 kg |
| Paper | 1.1 | 1.10 kg | +0.10 kg | +0.075 kg | 1.20 kg |
| Glass | 0.85 | 0.85 kg | +0.10 kg | +0.075 kg | 0.95 kg |
| Concrete | 0.13 | 0.13 kg | +0.10 kg | +0.075 kg | 0.23 kg |
Transport add-ons above assume a 1 kg (0.001 tonne) product. Materials usually dominate the total for a small item.
♻Low-Carbon Material Swaps
| Instead of | Swap to | Factor Before | Factor After | Approx Cut |
|---|---|---|---|---|
| Virgin aluminum | Recycled aluminum | 11.5 | 1.2 | ~90% |
| Virgin steel | Scrap / EAF steel | 1.9 | 0.6 | ~70% |
| Virgin PET plastic | Recycled rPET | 3.5 | 1.8 | ~49% |
| Conventional cotton | Recycled / organic | 5.9 | 2.1 | ~64% |
| Virgin paper | Recycled pulp | 1.1 | 0.7 | ~36% |
| Air freight | Ocean ship | 0.60 | 0.015 | ~97% |
⚙Full Formula Breakdown
📋Stage Reference Values
| Stage | Driver | Formula | Typical Share |
|---|---|---|---|
| Materials | Weight & material choice | kg × factor | Often 50% to 80% |
| Manufacturing | Energy & grid mix | kWh × grid factor | Often 10% to 40% |
| Transport | Mode, distance, mass | t × km × mode | Small unless air |
| Air freight override | Airborne long-haul | t × km × 0.60 | Can dominate total |
💡Practical Carbon Tips
One hand holds an aluminum can, the other a plastic water bottle. Which one is worse for the environment? The answer is something most people don’t realize: their gut feeling may lead them astray when it comes to carbon emissions. For example, they think lightweight must mean good; they believe natural fabrics (such as cotton) are automaticly green. But that’s not true.
A lot of the environmental cost gets hidden behind extraction, smelting, and freight energy needed. To get to the bottom of this, we need to step back from appearances… What weighs less or looks nicer on the shelf… And examine full lifecycle of material. Almost all products generate their carbon debt at the material stage. The thing we think matters, the thing we see when we buy something, the shape of the final object (are typically not the story), it’s how it was created and from what.
Why Your Guess Is Often Wrong
Take aluminum, for example. To smelt new aluminum require huge amounts of electricity, emitting lots more than either plastic or steel. And once that aluminum has been produced, leaving the factory, it carry that energy cost with it. This part, the material sourcing and creation, is typically half to three-quarters of the total emissions of any product if you’re designing something or selecting your material inputs. Using recycled aluminum, for instance, reduces these emission by almost ninety percent. Consumers have ability here: through their purchases they could significantly reduce this one thing.
Consider one other aspect: manufacturing energy. Depending on how it gets its power (renewable versus coal), any factory producing the same items will produce different levels of carbon. Even though it might take longer to ship, you can reduce this impact by selecting suppliers that operate out of areas with a cleaner energy mix. While transport emissions recieve plenty of headlines, unless you’re using air freight, your material selections matter far more. Ocean shipments remains highly efficient at moving weight over distance. When flying something around the globe, however, you multiply the impact by forty times and beyond. This is a trade-off that many companies fail to factor into their decision-making process, opting for speed instead of sustainability.
This is why I built this tool: to help make those tradeoffs visible in a way that’s obvious. Just plug in what materials weigh (per unit), how far they traveled (in miles), and how much energy was used to manufacture them (per unit), and the calculator will show you exactly where your emissions are. By using industry-standard emission factors, it takes the guesswork out of it, letting you get a realistic sense of the impact… From raw materials sourcing through to the finished product leaving the factory. Best of all, it lets you easily compare scenarios side-by-side, like comparing the emissions associated with trucking vs. Taking the train. Instead of providing only a bottom-line result, it highlights specifically what contributes most to the final number, allowing you to focus on what makes the biggest difference. They’re approximations from averages, but accurate enough to point out huge areas for improvement.
“If you change materials slightly, that can be orders-of-magnitude better then changing something like your transportation by 10 km.” The objective isn’t perfection; it’s progress. It’s about making choices with information. When you know how much something weighs and how far it traveled, you begin to view things differently. You don’t wonder, what color does this look green? You wonder, what had to happen for me to have this right now? You can reduce a product’s footprint by being aware of energy and being efficient with your material. Be mindful of your resource consumption, but know that there is no way to completely eliminate our emissions. It’s the same whether you’re a consumer or a manufacturer. Question your assumptions when it comes to synthetic vs. Natural materials. Always consider the hidden energy used in the making process.
Next time you grab something, wonder about all the steps taken from raw earth to finished good. And how much of that journey cost us in carbon.