Cap Rate Real Estate Calculator
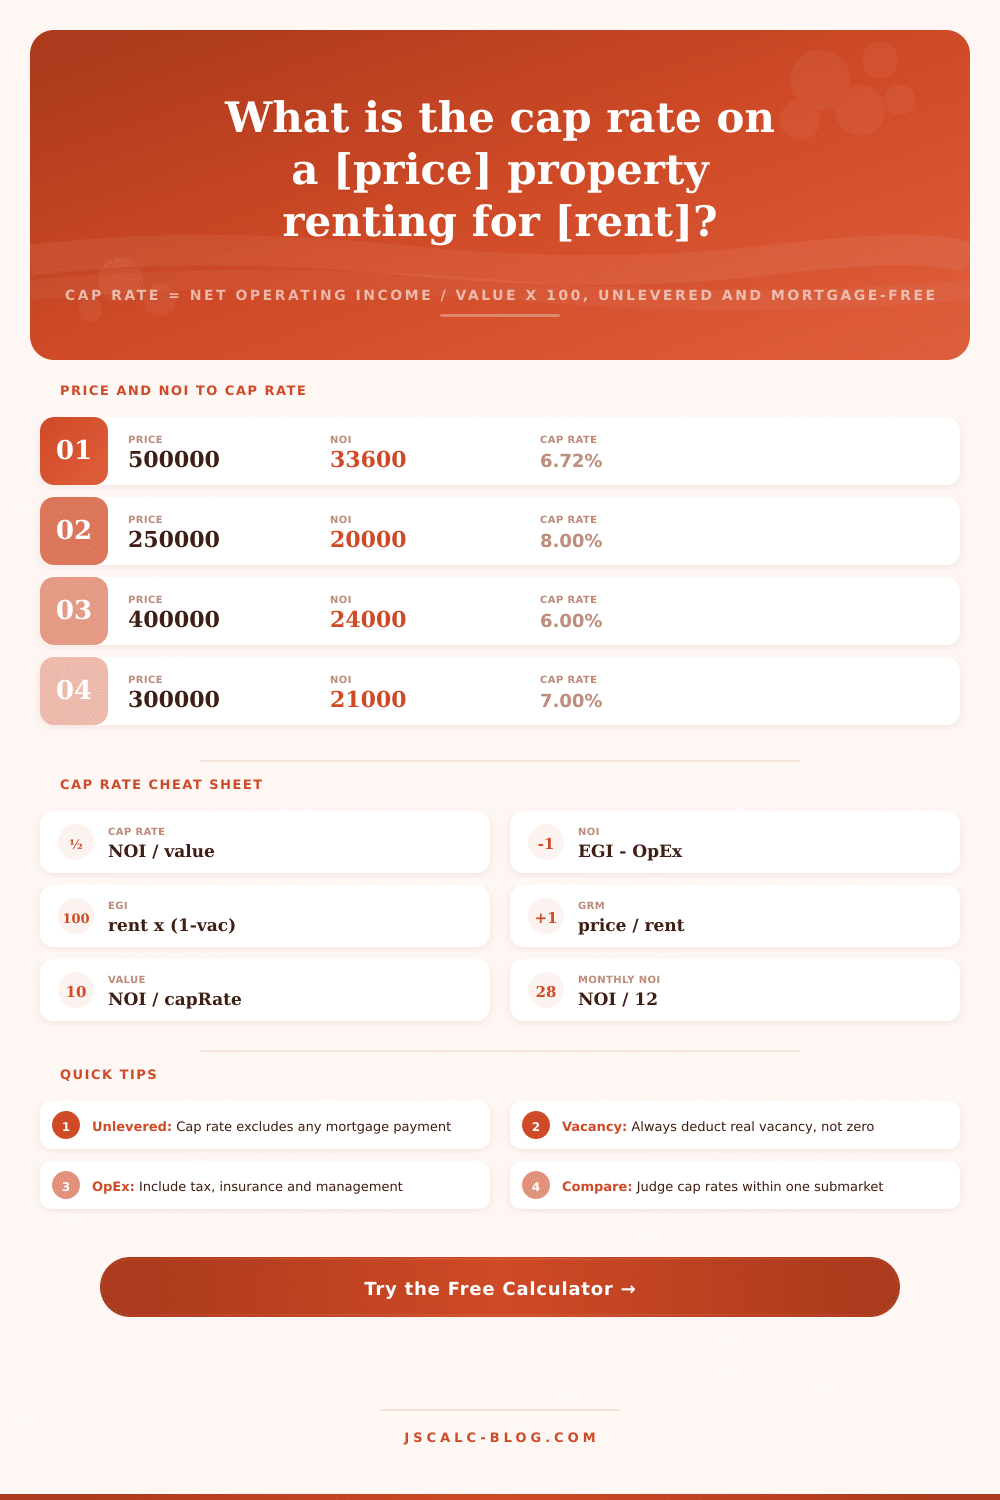
Find the capitalization rate on an income property using cap rate = Net Operating Income divided by value times 100. Enter the purchase price, gross rent, vacancy, and itemized operating expenses to get NOI, monthly NOI, the Gross Rent Multiplier, and the price implied by a target cap rate. Cap rate is unlevered, so mortgage and debt service are excluded from NOI.
🎯Real Property Presets
📝Property and Income Inputs
What you would pay or the current value of the property.
Total scheduled rent for a full year at full occupancy.
Expected empty time and unpaid rent as a percent of gross.
Cap rate a buyer would accept; drives the implied value.
Itemized annual operating expenses
Annual real estate taxes on the property.
Landlord or hazard insurance premium for the year.
Routine upkeep, turnover, and repair reserve.
Management fee as a percent of effective gross income.
Annual HOA or condo dues, if any.
Water, sewer, trash, or common-area power you cover.
Landscaping, pest control, licensing, or accounting. Exclude mortgage.
🔢Formula Snapshot
📊Typical Cap Rates by Property Class
| Property Class | Typical Cap Rate | Risk Profile | Location Pattern |
|---|---|---|---|
| Class A, new and stabilized | 4.0% - 5.5% | Lowest | Prime urban and suburban |
| Class B, well kept | 5.5% - 7.0% | Moderate | Established neighborhoods |
| Class C, older stock | 7.0% - 9.0% | Elevated | Working-class areas |
| Class D, distressed | 9.0% - 12.0%+ | Highest | Turnaround markets |
| Single-family rental | 5.0% - 8.0% | Moderate | Suburban |
| Small multifamily 2-4 units | 6.0% - 8.5% | Moderate | Infill and suburban |
| Neighborhood retail | 6.0% - 8.0% | Tenant driven | Commercial corridors |
📈Cap Rate vs Risk and Return
| Cap Rate Band | What It Signals | Price vs NOI | Investor Type |
|---|---|---|---|
| Under 4% | Premium asset or hot market | Very expensive | Appreciation seeker |
| 4% - 5% | Low risk, low yield | Expensive | Core institutional |
| 5% - 6% | Balanced primary market | Full price | Core-plus |
| 6% - 8% | Solid cash flow | Fair value | Value-add |
| 8% - 10% | Higher risk or effort | Cheaper vs income | Yield hunter |
| Over 10% | Distress or thin market | Deep discount | Opportunistic |
📏Gross Rent Multiplier Interpretation
| GRM Value | Price to Rent | Read As | Rough Cap Match |
|---|---|---|---|
| 5 | 5x annual rent | Very strong income | High cap |
| 7 | 7x annual rent | Strong income | 8% - 9% |
| 10 | 10x annual rent | Healthy | 6% - 7% |
| 12 | 12x annual rent | Priced up | 5% - 6% |
| 15 | 15x annual rent | Pricey | 4% - 5% |
| 20+ | 20x annual rent | Appreciation play | Under 4% |
🗃Property Type Comparison Grid
| Property Type | Typical Cap | Typical GRM | Vacancy | Risk | Notes |
|---|---|---|---|---|---|
| Single-family rental | 5% - 8% | 8 - 14 | 4% - 8% | Moderate | Easy to sell, one tenant |
| Duplex | 6% - 8% | 8 - 12 | 5% - 8% | Moderate | Two income streams |
| Fourplex | 6% - 8.5% | 7 - 11 | 5% - 10% | Moderate | Still residential financing |
| Small apartment 5-20 units | 6% - 9% | 6 - 10 | 5% - 10% | Elevated | Commercial underwriting |
| Class A urban tower | 4% - 5.5% | 13 - 20 | 3% - 6% | Low | Priced for appreciation |
| Secondary-market Class C | 8% - 11% | 5 - 8 | 8% - 15% | High | Strong cash flow, more work |
| Condo with HOA | 4% - 6% | 12 - 18 | 4% - 8% | Moderate | HOA fee lowers NOI |
| Short-term rental | 6% - 10% | 6 - 12 | Seasonal | Higher | Volatile gross income |
| Neighborhood retail strip | 6% - 8% | 7 - 11 | Lease based | Tenant driven | Watch lease rollover |
⚙Formula Breakdown
💡Cap Rate Investing Tips
Use the Cap Rate Calculator to see how much an asset is currently producing. A lot of properties look great on paper but has excessive operating costs hidden in the fine print. Rent alone isn’t a great indicator because it doesn’t tell whole story. That’s why this tool cuts through the illusion of financing to give you a clear idea of actual annual return if you were paying 100% cash. No loan terms should spoils the answer; it simply gives you the answer to one simple question regarding today’s performance of building.
The Capitalization Rate is calculated by dividing Net Operating Income by Property Value and multiplying by 100. This is the only metric that ignores your tax position and your leverage (mortgage) and makes apples-to-apples comparisons between various properties possible. If two investors purchase the same property with dissimilar loan terms, they’ll have same cap rate. This means that the cap rate measures the performance of the asset itself… Not how it’s financed. Appraisers value properties using the cap rate because it isolates property risk from buyer preference.
What is a Cap Rate?
Before meeting with a lender, the cap rate gives you a sanity check. The cap rate sets a baseline reality check before you even talk to a lender and then you can calculate your cash-on-cash return later.
Next, it adjusts for vacancy/credit loss to get to effective gross income (gross scheduled rent minus vacancy and credit loss). Vacancy is when a unit sits unrented due to being repaired or between tenant; no landlord collects 100% of what they theoretically could collect. In addition, some checks will bounce. That cuts into the real income collected. For example, if I enter a realistic vacancy rate above 5%, my analysis will match real-world operations. A seller may quote me zero vacancy because they want the yield to appear more favorable. Underwriting with honest numbers will protect you from paying too much for potential that doesn’t yet exist. The calculator makes this adjustment automatically, eliminating the need to do mental arithmetic when assessing risk.
The next line is expense, where most amateurs lose their shirt. How reliable Net Operating Income is depend directly on the list behind it. It’s the expense breakdown: property tax, insurance, maintenance, management fees, HOA dues, utilities and so forth. Note that management is expressed as a percentage of effective income (managers charge on cash collected), not theoretical rent. More importantly, note that none of this include mortgage payments. Because debt service is a matter of choice (financing), it does not belong in operating expenses. If you want to know how much a building can make without your bank demanding interest, keep debt out off the picture. This way you’re measuring the building’s ability to create cash flow. Apart from its financing.
Then, we divide Net Operating Income by the purchase price and voila: the headline percentage. Lower cap rates signal a premium asset. This means the asset is in a hot market and receives an above-average valuation because buyers trade thin yield for upside potential (appreciation) or safety. Higher cap rates typically mean better immediate cash flow but also greater operational risk or age of infrastructure.
To give some perspective about what these caps mean, here are a few reference tables from the page: The ranges shown provide perspective for each property class; it’s important to understand where your property fits into the range for the specific submarket you’re in. Don’t compare your property against national averages. They may be off high or low depending on unrelated economic conditions. What matters most is understanding the local context.
It gives you an implied value based on your target return. It also provides a Gross Rent Multiplier to help you quickly screen the price-to-gross-rent. This multiplier ignores expenses but can be used as a rough first filter. But it’s the implied value function which is most useful: flipping the equation to show you what a property should cost if you want to achieve a certain return. If the property yields $33,000 of Net Operating Income and you’re looking for six percent, then the tool shows you that you are subsidizing another person’s profit margin when you pay any more different than five hundred fifty thousand dollars. It quantifies exactly how far off you could of go before you run out of room for error in your bid, forcing you to be disciplined.
To demonstrate this, let’s use some of the property type presets to highlight how variable changes impact results. For example, a condominium with very high HOA fees will depress Net Operating Income by a lot. That makes its effective cap rate much lower, despite what appears like a steady rent. Alternatively, a short-term rental may appear to have higher gross income, but has unpredictable vacancy patterns that traditional long-term analysis fail to reflect well. By adjusting these variables by hand, you can stress test your assumptions before deployment.
This isn’t so much about achieving one number versus another. It’s about understanding the structure of the deal behind the number and seeing how any changes in the variables will impact the outcome. Opportunity is disguised as analysis when people get optimistic about cap rates. A seemingly okay investment becomes a cash-flow hellhole. You bleed your own wallet month after month because you miss one line item, like the management fee, or misjudge another, like maintenance reserves. This calculator separates out operating costs from income stream, and keeps debt service in its own silo so that it spits out a justifiable number which you can take to the table or exit stage right.
Use the presets and tweak them based on your local market conditions. Then, trust the numbers to tell you if this property should be making you money or simply taking up your time. If you give it the truth, the number won’t lie.