Buy Home vs Rent Calculator
Compare the true cost of buying a home versus renting over the years you plan to stay. This tool models your mortgage, property tax, insurance, HOA, maintenance and home appreciation on the buy side, and rent growth plus the investment return on your kept-invested down payment on the rent side, then finds the break-even year when owning turns cheaper.
🎯Real Buy vs Rent Scenarios
🏠Buying Inputs
Purchase price of the home you would buy.
Cash paid up front; the rest is financed.
Annual rate; divided by 12 for the monthly rate.
Length of the mortgage, usually 15 or 30 years.
Yearly tax as a percent of the home value.
Homeowner insurance premium per year.
Homeowner association dues per month, if any.
Upkeep and repairs as a percent of home value.
Expected yearly rise in the home value.
💰Renting and Horizon Inputs
Current rent for a comparable place.
How much rent rises each year.
Return if a renter invests the down payment and monthly savings.
Time horizon for the whole comparison.
🔢Formula Snapshot
🏠Monthly Cost of Owning Components
| Component | How It Is Found | Example ($400k home) | Note |
|---|---|---|---|
| Principal & interest | Amortized loan payment M | $2,023 / mo | 20% down, 6.5%, 30 yr |
| Property tax | Value x 1.1% / 12 | $367 / mo | Rises as value grows |
| Home insurance | $1,500 / 12 | $125 / mo | Annual premium spread out |
| HOA dues | Entered per month | $0 / mo | Condos often $200 to $500 |
| Maintenance | Value x 1% / 12 | $333 / mo | Repairs and upkeep reserve |
| Total PITI + extras | Sum of the above | $2,848 / mo | The owning cost card |
💵Renting Cost Components
| Component | How It Is Found | Effect on Net Cost | Note |
|---|---|---|---|
| Rent paid | Monthly rent, grown yearly | Adds to renter cost | Never builds equity |
| Annual rent increase | Rent x (1 + increase %) | Raises later years | 3% is a common estimate |
| Down payment invested | Kept in the market | Grows and offsets rent | Opportunity cost of buying |
| Monthly savings invested | Own cost minus rent, if positive | Grows and offsets rent | Renter banks the gap |
| Investment growth | Balance x (1 + return / 12) | Subtracts from cost | 6% to 8% typical long term |
| Renter insurance | Small, often under $200 / yr | Minor add-on | Not modeled separately |
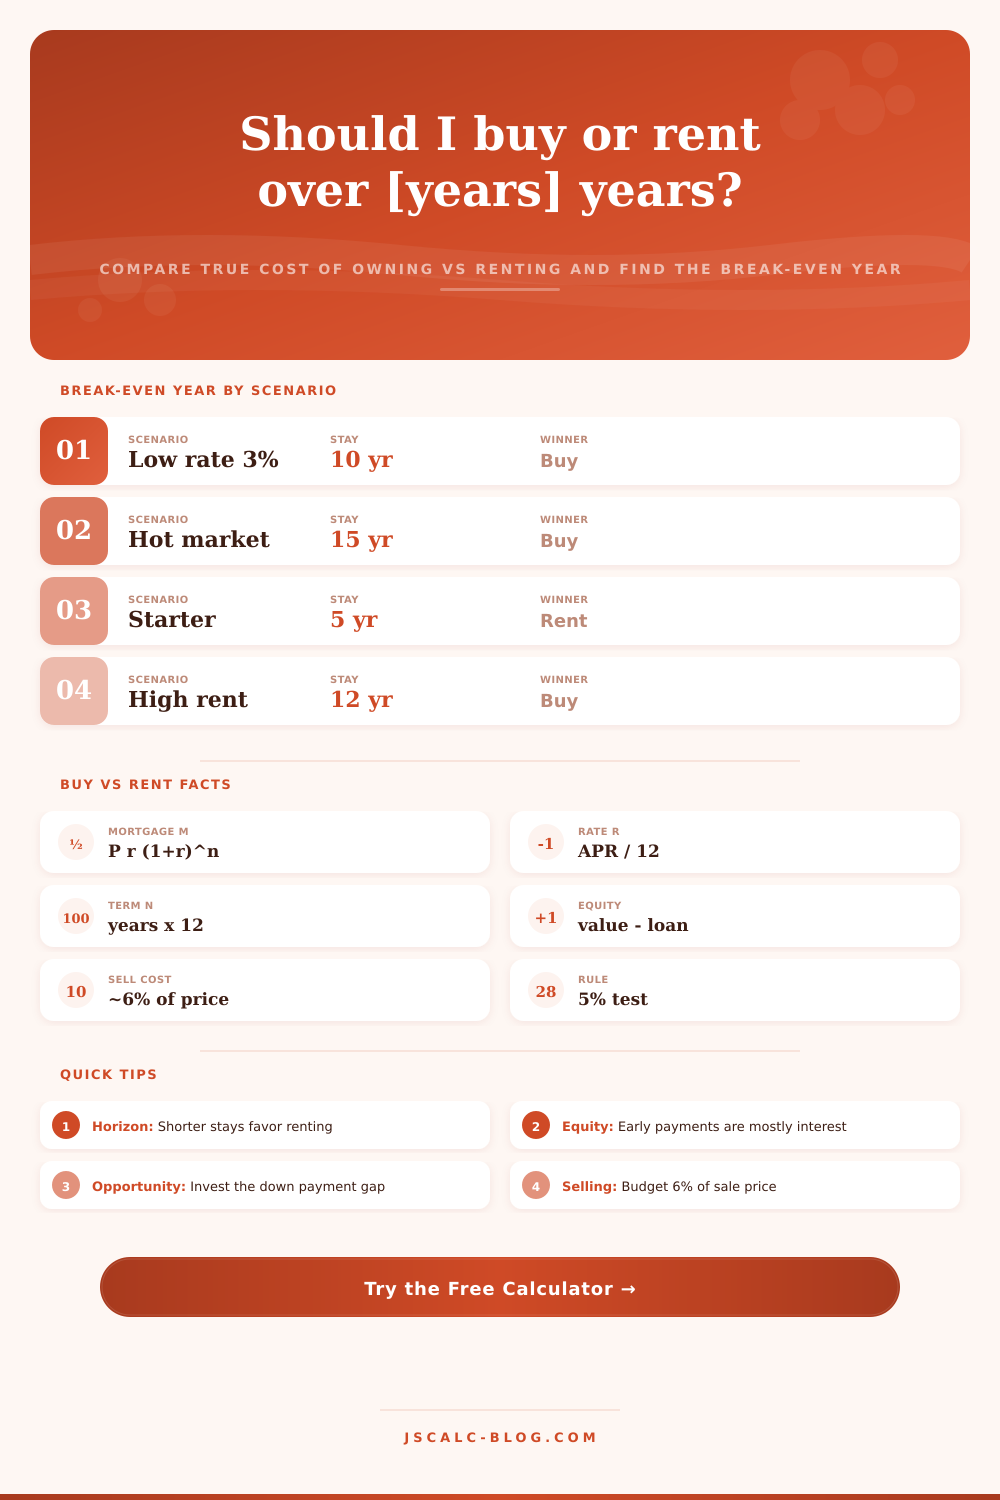
📊Break-Even Year by Scenario
| Scenario | Rate | Appreciation | Break-Even | Winner if You Stay |
|---|---|---|---|---|
| Low rate 3% | 3.0% | 3.5% | Year 2 | Buy after 2 years |
| Hot appreciation | 6.5% | 4.5% | Year 3 | Buy after 3 years |
| Expensive rent town | 6.5% | 5.0% | Year 2 | Buy after 2 years |
| Balanced default | 6.5% | 3.0% | Beyond 7 yr | Rent short term |
| Flat market | 6.5% | 1.0% | Rarely | Rent favored |
| Condo high HOA | 6.5% | 3.0% | Beyond 10 yr | Rent unless long |
| Long stay 20 yr | 6.5% | 3.0% | Later years | Buy over 20 years |
| Short stay 3 yr | 6.5% | 3.0% | Not reached | Rent for 3 years |
📅Year-by-Year Buy vs Rent Comparison
| Year | Cumulative Buy Cost | Cumulative Rent Cost | Equity Built | Home Value | Cheaper Option |
|---|---|---|---|---|---|
| Run the calculator to build your year-by-year table. | |||||
⚙Formula Breakdown
💡Buy vs Rent Decision Tips
Renting vs. Buying is typicaly portrayed as a matter of morality. Like you’re somehow a bad person if you don’t buy a home. But that narrative doesn’t consider the true costs of homeownership and potential gains from investing your saved cash.
This calculator models both scenarios in an apples-to-apples way: side-by-side, year by year, until point where owning finally becomes more economical then renting. It doesn’t simply compare monthly payments, but rather true cumulative costs. A low mortgage payment can mask high maintenance and taxes, while a high rental payment could be offset by strong investment returns on your down payment.
Renting vs. Buying: Which Saves More Money?
Here’s how most folks begin: they compare today’s rent against the amount they’ll pay on a mortgage. This is already faulty analysis. When buying, the principal-and-interest figure doesn’t represent your entire housing cost. You also pays homeowners insurance and property tax. You may also have homeowner-association fees and maintenance reserve, which is typically around one percent of the house value per year. Sum that all up, and it might be much more than your loan payment alone!
Meanwhile, when you rent, you aren’t “losing” the money you’d save if you paid less taxes; or didn’t make a down-payment. You’re investing it. And that investment grows. Your fair comparison needs to include that growth rate. Otherwise, you’ve given buying an unfair advantage.
This tool uses basic amortization equations to show how much of every mortgage payment go toward principal versus interest. Interest. (Hint: Most is interest, especially during the first few years of a 30-year mortgage. That’s why building equity on your house is slow.) Meanwhile, house prices appreciate. Well, at whatever rate they happen to appreciate in your market, typically around three percent per year. That number can vary greatly from one place to another. The tool assumes your house appreciates at that rate each year, compounded.
At some point, you sell the house. You get back what it was worth, plus amount of increase in value, less what you owe on your mortgage. But there’s a catch: There are costs associated with selling. The tool assumes about six percent of the sales price will be deducted to account for closing costs and real estate agent commission. People often overlook this large expense when they quickly compare prices.
On the renter side: The calculator assumes that you’re savvy. You put down a downpayment, and you save money every month by renting instead of owning. It then invests all those amounts at rate of return you choose. That’s the opportunity cost, and that’s where the battle plays out. Your investment portfolio might earn more than your house does if the stock market has a good year and the housing price doesn’t go up much. In that case, the net cost of renting is the full amount of rent you pay, less how much that investment portfolio grows. What matters isn’t just what you spend, but what you do with the money you don’t.
When this happens, you get a break-even year. It’s the moment when the cumulative net cost of buying equals the cumulative net cost of renting. In all years leading up to this moment, renting was more financially effective. In all years following this moment, buying was more financially efficient. If you intend to leave before reaching this break-even moment, you’re mathematically better off renting, no matter what you think about houses.
The default scenarios illustrates this. Transaction costs consume any equity gains you might see, making even a quick three-year occupancy nearly always better for renting than buying. On the other hand, most 15-year periods tend to favor buying: Given enough time, appreciation and principal-paydown can offset these transaction fees.
These are dials for your assumptions. If you’re in a flat market, lower the appreciation rate. If you believe that the markets will continue doing well, raise the investment return. Observe what happens to the break-even year. Does it jump from year five to year eight? Or does it vanish altogether? That’s the value of a sensitivity analysis, far more so than one single number. No calculator can ever predict the future. But it can show exactly how vulnerable your decision is based on what it predicts.
So how do you choose? Well, it all comes down to how comfortable you are taking risks, and how much time you have. If you’re looking at staying less than five years, then renting gives you the freedom to leave while owning ties you down. And it’s more work. You put in hard work when you maintain your property.
The calculator makes the unseen trade-offs clear in terms of dollar amounts. It shows why so many people (particularly those who plan to live fewer than five years) aren’t “failing” by renting, they’re simply making a smart financial decision. When you look at the whole picture (fees, taxes, investment returns, selling expenses), you get out of guessing mode and into decision-making mode. Numbers don’t give a crap about tradition; they only care about bottom line.