Bonus Payout Calculator
Estimate gross bonus payout from eligible earnings, target bonus percent, performance multiplier, company funding, proration, thresholds, caps, and estimated withholding.
Plan type can load realistic targets, thresholds, and caps.
Use bonus-eligible earnings, not necessarily total W-2 or total payroll.
Example: enter 12 for a 12% target bonus opportunity.
Use 1.00 for target performance, 1.20 for 120% achievement.
Funding pools often range from 0% to 150% of target.
If performance is below this multiplier, payout is set to zero.
The cap limits the combined performance and company funding effect.
Proration is applied after threshold and cap handling.
Optional net estimate only; actual payroll withholding can differ.
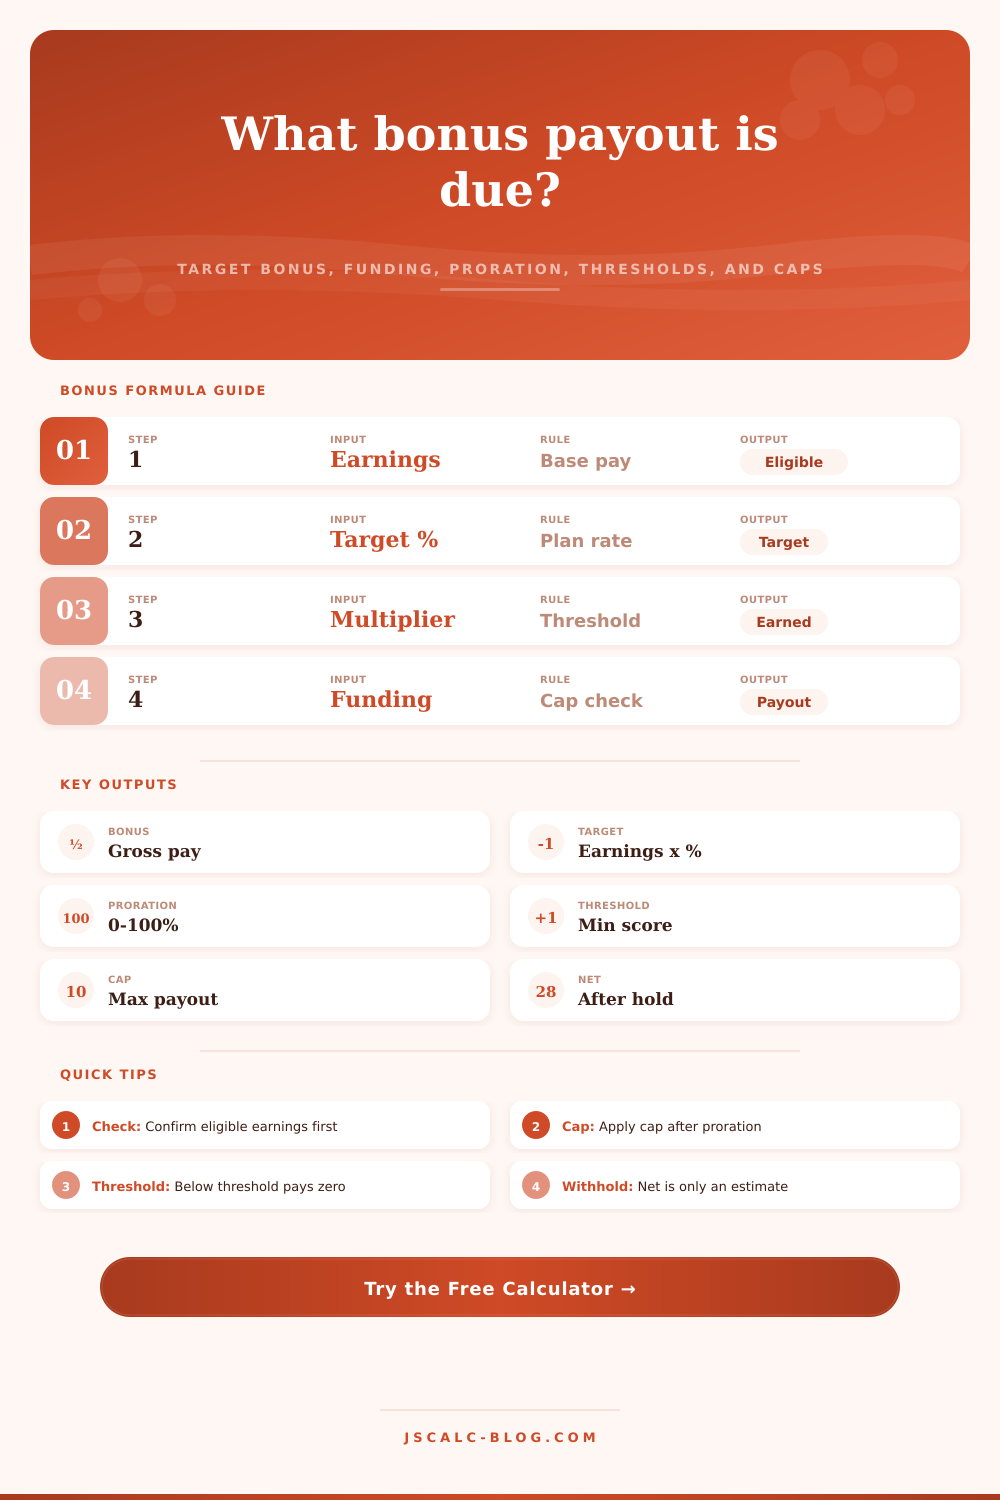
Target bonus = eligible earnings x target bonus percent
Formula bonus = target bonus x performance multiplier x company funding percent
Final gross bonus = min(formula bonus, target bonus x cap multiplier) x proration factor
Threshold rule sets the payout to $0 when the performance multiplier is below the minimum payout threshold.
| Formula Step | Calculation | When Applied | Effect on Payout | Common Audit Check |
|---|---|---|---|---|
| Eligible earnings | Base bonusable pay for the plan period | First | Sets the dollar base | Exclude ineligible allowances or one-time payments |
| Target percent | Earnings x target bonus % | After earnings | Creates target opportunity | Use the target for the employee's role and grade |
| Performance multiplier | Target bonus x score multiplier | Before funding | Rewards above-target or below-target achievement | Confirm threshold before multiplying |
| Company funding | Performance result x funding % | After individual or plan performance | Reflects funded pool size | Use the final approved funding percent |
| Payout cap | Target bonus x cap multiplier | After formula bonus | Limits upside payout | Check whether cap is pre- or post-proration |
| Proration | Eligible service / plan year | After cap in this calculator | Adjusts for partial-year eligibility | Match the plan document's month or day method |
| Plan Type | Common Target Bonus | Threshold Multiplier | Target Payout | Typical Cap | Best Use Case |
|---|---|---|---|---|---|
| Corporate annual incentive | 5% to 15% | 0.70x to 0.80x | 1.00x | 1.50x to 2.00x | General professional and corporate roles |
| People manager incentive | 10% to 25% | 0.75x to 0.85x | 1.00x | 1.75x to 2.00x | Managers with team and business goals |
| Sales leadership incentive | 20% to 45% | 0.80x to 0.90x | 1.00x | 2.00x to 3.00x | Revenue leaders with quota-linked outcomes |
| Executive annual incentive | 40% to 100% | 0.80x to 0.90x | 1.00x | 2.00x to 3.00x | Senior leaders with company scorecards |
| Operations gainsharing bonus | 3% to 12% | 0.65x to 0.80x | 1.00x | 1.25x to 1.75x | Safety, quality, productivity, and output plans |
| Nonprofit performance bonus | 3% to 10% | 0.70x to 0.85x | 1.00x | 1.25x to 1.50x | Mission, grant, program, and stewardship goals |
| Retention milestone bonus | 5% to 20% | Usually service-based | 1.00x | 1.00x to 1.25x | Project completion or stay-through-date awards |
| Commission plus bonus blend | 5% to 25% | 0.80x to 0.95x | 1.00x | 1.50x to 2.50x | Roles with both commission and bonus scorecards |
| Performance Result | Multiplier Range | Threshold Status | Payout Treatment | Planning Note |
|---|---|---|---|---|
| Below threshold | 0.00x to 0.74x | Below minimum | Usually $0 | Confirm whether any discretionary minimum applies |
| Threshold achieved | 0.75x to 0.89x | Eligible | Reduced payout | Good for minimum funding or partial scorecard delivery |
| Near target | 0.90x to 0.99x | Eligible | Slightly below target | Check exact interpolation rules if scorecards use points |
| Target performance | 1.00x | Eligible | Target payout before funding | Company funding can still move final payout |
| Above target | 1.01x to 1.49x | Eligible | Above-target payout | Review cap headroom before communicating estimates |
| Maximum performance | 1.50x to 3.00x | Eligible | May be capped | Cap and funding interaction can create a hard ceiling |
| Proration Method | Formula | Example Input | Proration Factor | When It Fits |
|---|---|---|---|---|
| No proration | 1.00 | Full eligibility | 100.0% | Full-year employee or plan says no adjustment |
| Months worked | Eligible months / plan months | 9 / 12 | 75.0% | Simple new-hire, promotion, or transfer plans |
| Half-year eligibility | Eligible months / 12 | 6 / 12 | 50.0% | Mid-year hire or mid-year plan entry |
| Days eligible | Eligible days / plan days | 274 / 365 | 75.1% | Precise leave, termination, or transfer calculations |
| Leap year days | Eligible days / 366 | 183 / 366 | 50.0% | Plans that require calendar-day precision |
| Capped partial year | Cap first, then prorate | 1.8x capped at 1.5x | Depends on service | Plans where the cap applies to full-year opportunity |
| Scenario | Eligible Earnings | Target Bonus | Performance | Funding | Proration | Cap | Estimated Gross Bonus |
|---|---|---|---|---|---|---|---|
| New hire corporate | $68,000 | 8% | 1.00x | 100% | 6 / 12 | 1.50x | $2,720 |
| Manager meets plan | $105,000 | 15% | 1.00x | 95% | 12 / 12 | 1.75x | $14,963 |
| Sales leader stretch | $145,000 | 30% | 1.25x | 110% | 12 / 12 | 2.00x | $59,813 |
| Below threshold | $82,000 | 10% | 0.68x | 100% | 12 / 12 | 1.50x | $0 |
| Company overfunded | $92,000 | 12% | 1.15x | 130% | 12 / 12 | 1.75x | $16,505 |
| Executive capped | $240,000 | 60% | 1.55x | 125% | 12 / 12 | 1.80x | $259,200 |
| Mid-year promotion | $118,000 | 20% | 1.10x | 105% | 7 / 12 | 2.00x | $15,899 |
| Leave adjusted days | $76,000 | 9% | 1.02x | 90% | 310 / 365 | 1.50x | $5,331 |
| Commission blend bonus | $125,000 | 18% | 1.35x | 100% | 12 / 12 | 2.25x | $30,375 |
Calculator reference prepared for JSCalc-Blog.com.
Bonus season is here… A time of year when your focus turns not on your work results but rather on the fine print in your bonus check. Even if you’ve been a rockstar all year long, delivering for your clients and achieving your targets, the size of that paycheck still makes you nervous.
That’s due to the gap between what you were told you’d recieve (the quoted percentage) and the payout formula (which differs). Knowing about this divide will help set reasonable expectations around how much money you’ll see in your bank account.
How to Understand Your Bonus
Bonus plans don’t take into account all compensation (that’s why it’s confusing for employees, most believe the target percent is based off their entire W-2 income). Typically, bonuses is based only on “eligible earnings.” This amount may include base pay minus a portion of other base salary. It can also includes or exclude allowances, overtime, and variable pay.
When using a calculator, don’t plug in your gross salary; you’re building your expectations upon a flawed number. Once you know the right number to plug in, your eligible earnings; let the calculator do the rest.
An opportunity is target percentage. While the target percentage creates opportunity, the performance multiplier determine reality, but funding percentages and caps are also critical factors that determines the final payout.
Most plans have a threshold, a minimum performance level that will cause the payout to be zeroed out if you come up short. This kill switch are there to protect the company from having to pay for poor performance. Understand where this line is and focus on the metrics that will help you remain eligible. Just one little dip in your score around the threshold can knock out the whole bonus. So make sure you’re sitting above that line before you try to max out profit.
The complication with funding percentages is that they correlates company health with individual effort. If you reach 120% of your target, but your company’s funding percentage sits at 80%, you’ll still receive less then expected. This means that your bonus is a sharing of risk: it’s based on what you achieve personally while also depending on how profitable the company as a whole was.
To ensure there isn’t too much payout in good years, the cap multiplier put an upper bound on the upside. That’s why these caps are budget controls to keep the plan sustainable. When you see a high performance score, be sure to understand how much the cap has limited it.
The last one that catches people off-guard (especially if they joined in the middle of the year) is proration, which change your final number based on how much time you worked to qualify for it. That means there’s no penalty for getting only half a year of service, since this comes after the threshold/caps. If your full bonus is $20k but you only worked seven months, you’d see around an $11,000 payout. Not bad!
That’s the table on the page with all these references. It’s just basic math, but it makes a big difference when it comes to the size of your check.
The final step is merely informational to estimate withholding. Bonuses are often taxed at a flat rate that might feel high compared to your normal income. Instead of spending money that gets withheld, seeing an estimated net figure helps guide bill planning.
What do the figures mean? How does it work? What’s the deal with eligible pay? What about caps? What about funding? What about thresholds?
Once you get a handle on this, the bonus is no longer a surprise but rather an expected outcome. You know it’s going to vary so you can prepare for it. It’s always the same math, and you could of counted on that math at the end of the year.