Sales Forecast Calculator
Forecast sales from committed bookings plus weighted pipeline, then compare quota coverage, close rate, average deal size, sales cycle timing, and period run-rate.
Closed-won or contractually committed bookings inside the selected period.
Used for forecast coverage and remaining gap.
Run-rate projection uses committed bookings divided by elapsed selling days.
Used to estimate equivalent deals required for the remaining quota gap.
Close rate = won opportunities / won plus lost opportunities.
Forecast = committed bookings + sum(stage pipeline × probability)
Committed bookings stay separate from open pipeline because they are already won or contractually committed. Each open stage is multiplied by its own probability before being added to the forecast.
Run-rate projection = committed bookings / elapsed selling days × total selling days. This compares booked pace against the weighted forecast.
Close rate = wins / (wins + losses). Average deal size is calculated from committed bookings and opportunities won, with the expected average deal size used for gap planning.
| Calculation | Inputs Used | Formula | Decision Signal |
|---|---|---|---|
| Weighted pipeline | Each stage amount and probability | Amount × probability, then summed | Expected bookings from open opportunities |
| Sales forecast | Committed bookings plus weighted pipeline | Committed + weighted pipeline | Best single estimate for the period |
| Quota coverage | Sales forecast and target | Forecast / target | Whether the plan is above or below goal |
| Run-rate projection | Committed bookings, elapsed days, total days | Committed / elapsed days × total days | Pace check against weighted forecast |
| Average deal size | Committed bookings and wins | Committed / won opportunities | Deal count needed for the remaining gap |
| Cycle fit | Days remaining and sales cycle length | Days remaining / cycle length | How much full-cycle selling time remains |
| Pipeline Stage | Typical Probability | Evidence Needed | Common Slip Risk | Forecast Use |
|---|---|---|---|---|
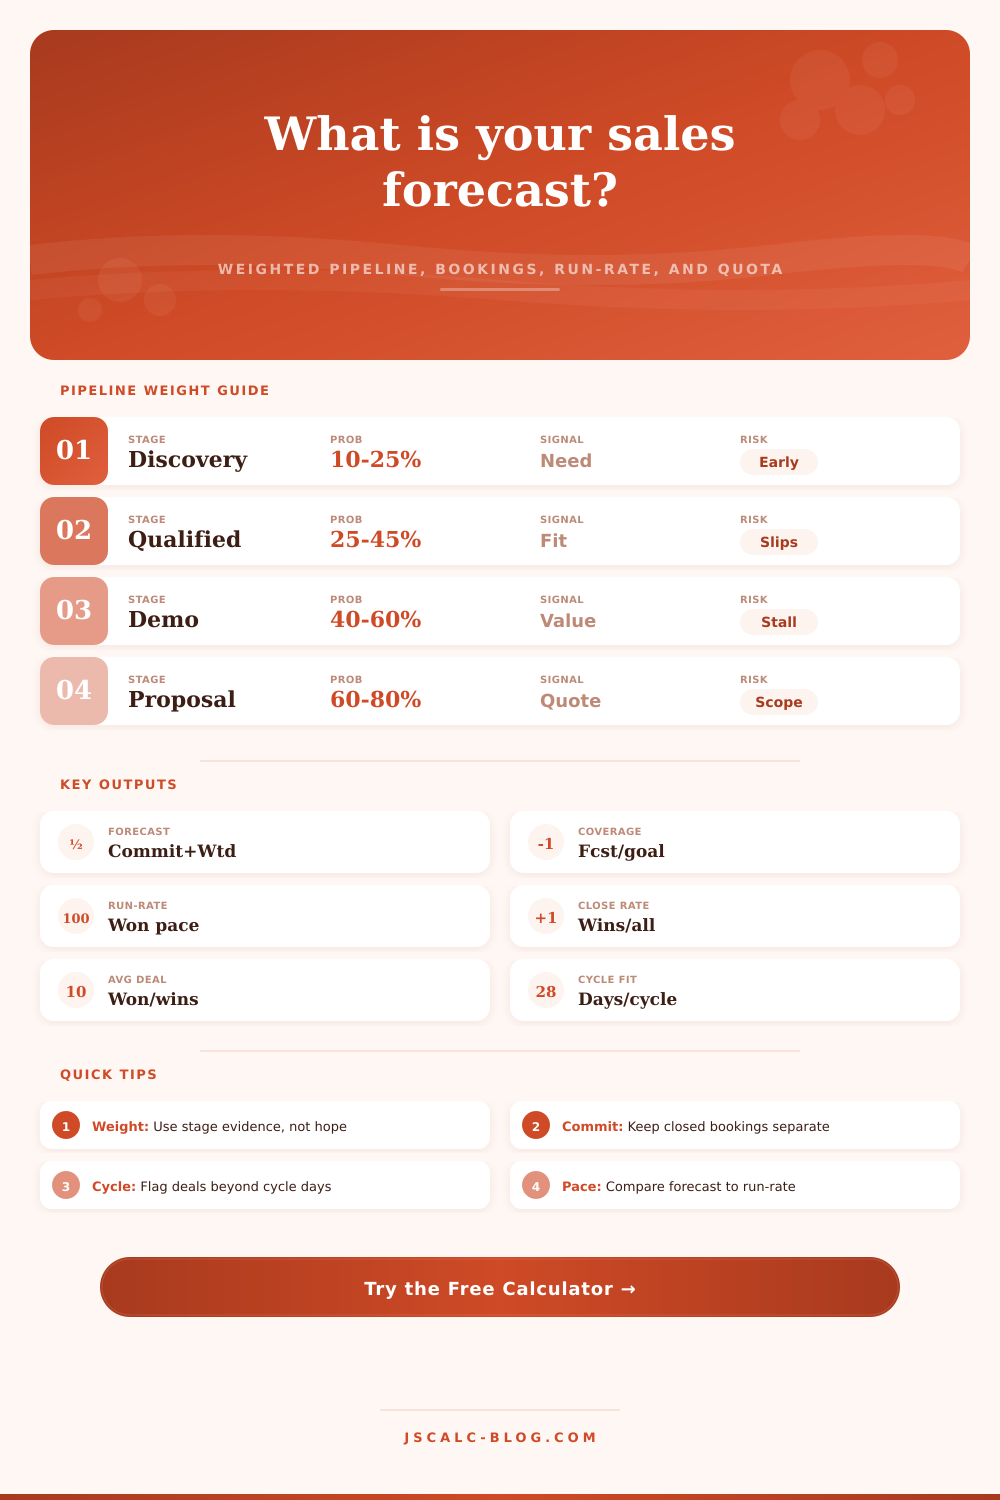
| Discovery | 10% to 25% | Confirmed need, named stakeholder, next meeting booked | Problem is interesting but not urgent | Longer-range upside, rarely commit-heavy |
| Qualified | 25% to 45% | Fit, budget path, success criteria, close date hypothesis | Champion lacks buying process access | Useful for early forecast coverage |
| Demo or evaluation | 40% to 60% | Product fit validated and business case in progress | Technical review stalls or value is unclear | Core weighted pipeline for the period |
| Proposal | 60% to 80% | Commercial offer shared and decision process known | Procurement, legal, scope, or discounting delays | Near-term forecast driver |
| Negotiation | 75% to 90% | Mutual close plan, paper process, decision owner aligned | Signature timing slips past period end | High-confidence open pipeline |
| Committed | 95% to 100% | Signed agreement, purchase order, or binding verbal commit | Fulfillment or booking policy exception | Included as committed bookings, not weighted pipeline |
| Scenario | Committed | Open Pipeline | Weighted Pipeline | Forecast | Target | Coverage | Close Rate |
|---|---|---|---|---|---|---|---|
| New SDR team ramp | $28,000 | $210,000 | $54,000 | $82,000 | $120,000 | 68% | 22% |
| Agency retainer month | $64,000 | $175,000 | $78,000 | $142,000 | $150,000 | 95% | 41% |
| Retail expansion sprint | $92,000 | $260,000 | $121,000 | $213,000 | $220,000 | 97% | 37% |
| B2B SaaS mid-month | $185,000 | $576,000 | $260,000 | $445,000 | $450,000 | 99% | 39% |
| Manufacturing distributor | $240,000 | $730,000 | $318,000 | $558,000 | $600,000 | 93% | 34% |
| Healthcare evaluation | $310,000 | $880,000 | $412,000 | $722,000 | $750,000 | 96% | 31% |
| Channel partner plan | $420,000 | $1,180,000 | $510,000 | $930,000 | $1,000,000 | 93% | 29% |
| Enterprise quarter end | $680,000 | $1,750,000 | $965,000 | $1,645,000 | $1,600,000 | 103% | 43% |
| Sales Motion | Best Period View | Stage Review | Run-Rate Watch | Cycle Watchpoint |
|---|---|---|---|---|
| Self-serve or PLG | Monthly | Trial, activation, conversion, expansion | Daily bookings and weekly conversion | Short cycles expose weak demand quickly |
| Inside sales | Monthly or quarterly | Qualified, demo, proposal, close plan | Weekly committed bookings against quota | Deals created late may need next-period treatment |
| Field sales | Quarterly | Discovery depth, champion strength, proposal quality | Biweekly booked pace and late-stage conversion | Travel, procurement, and stakeholder timing can slip |
| Enterprise sales | Quarterly or annual | Mutual close plan, legal path, decision date | Committed bookings plus signed-paper timing | Long cycle means early-stage pipeline rarely closes fast |
| Channel partner sales | Quarterly | Partner-sourced stage evidence and end-buyer status | Partner commit quality and end-customer booking policy | Indirect visibility can inflate probability |
| Renewal and expansion | Monthly or quarterly | Renewal risk, expansion proof, usage growth | Renewal commits separated from expansion upside | Contract end dates anchor timing more than lead age |
Calculator reference prepared for JSCalc-Blog.com.
Sales prediction meetings are where dreams go to die (or at least get smothered in spreadsheets). You arrive excited about your full pipeline, until you see the math. That’s because revenue need probabilities, whereas human brains perceive potential. Because most teams assume all their deals is equally likely, they miss their quotas by large amounts.
Weighting those deals correctly represent the difference between a believable prediction and a hopeful guess. It’s not about predicting signings. It’s about calculating a reasonable chance for each stage, using evidence (not intent).
How to Make Better Sales Predictions
There’s a 10% chance I’ll close this month on a deal we signed during discovery. Why? Because history say so. It is not because the sales rep are excited after their initial call. Now take that 10%, multiply it by size of the deal and you’ve got a reasonable contribution to your prediction. So you’re left with what’s realy going on in the market, stripped down and bare. No more noise.
You can use the calculator above and simply input your pipeline values. It does all the math for you, saving you the headache of having to multiply things yourself and miss bigger trend.
Treating an open pipeline as a committed booking is the danger. Committed booking mean contractually booked or the money’s in the bank. It’s a completely different risk profile than open pipeline. Keep this separate. If they mix it all together, then they muddy the water.
If they know they has a hundred grand in closed deals, well then that’s the floor. Anything above that is upside, but risky upside. The thing about tool is it separates these two so clearly. So you can see exactly what’s at risk and not at risk. And that makes a difference if you’re going to hire people or not hire people, or you’re going to freeze on hiring.
That’s why I say use the run-rate metric as your pace check. Even with a large pipeline, if it’s half-way through the quarter and you’ve only booked thirty percent of what you’re supposed to, then your run-rate is low. It feels like everything’s safe, you’ve got a huge pipeline and some late-stages. But your sales cycle are on average sixty days long, and there are only twenty more days in the quarter. Those deals aren’t gonna close.
The input for cycle length makes you confront reality of time. There is no way to shrink a sixty day buying process down to twenty days just because you need to hit the number. Knowing this would of stop you from having any false hopes about magically accelerating late-stage deals.
The other quiet killer is close rate. Lost fifteen, won five? That’s a close rate of twenty percent. Just because you think the market is hot this year doesn’t mean you can predict that it’ll be fifty percent. Your mood is not as good a predictor as history.
Average deal size also come into play here. Let’s say you expect an average deal size of eighteen thousand dollars but you’re attempting to fill out the gap with fifty thousand dollar deals. The math starts getting dicey. You’re banking on outliers. Plan based off the average. Boring? Yep. Accurate? Yep. Hope isn’t data.
Stage evidence must drive chances. If there’s a known paper process with a named decision owner, then set the probability of closing this deal as high. But otherwise, reduce it by 10-20 points. Harsh? Sure. Honest? You bet.
Keeping your probabilities to high for too long causes most prediction misses. If a deal slips, the probability should goes down right now. That will keep your prediction current and avoid that last minute scramble when deals stall at the door. But we don’t want to be pessimistic here. We just want to be precise.
Being precise helps us take action. We see a gap? You know precisely how many deal you have to win and what level of revenue you has to generate to fill that gap. Is there a strong run-rate? Breathe easy. The tool breaks this down clearly for you, with the gap, the remaining time, the coverage. Cut through the noise with it.
Predicting isn’t about crystal balls; it’s about disciplined arithmetic. Take away the emotion, trust the weights, and you’ll be able to see your way forward a lot more clear. And that clarity is more valuable than a comfortabley number.