6 Sided Dice Probability Calculator
Work out the exact odds for any number of six sided dice: the chance of a specific value, at least one hit, both an exact sum and a minimum sum, plus the ways to make it and the expected total.
🎲Real Dice Presets
📝Roll Setup
Each d6 is fair with faces 1 through 6. Up to 12 dice.
Used by the value based conditions.
Used by the exactly K dice condition.
Used by the sum conditions. Range is N to 6×N.
Estimates how many successes across this many rolls.
🔢Formula Snapshot
📊Sum Distribution
| Sum | Ways | Total (6^N) | Probability | Odds Against |
|---|---|---|---|---|
| Enter values above to see the full sum distribution. | ||||
Every row is one possible total for the current dice count, built by convolving the single die faces.
🎯Single d6 Odds
| Event on One Die | Ways | Probability | Odds Against |
|---|---|---|---|
| Roll an exact value | 1 of 6 | 16.67% | 5 to 1 |
| Roll an even number | 3 of 6 | 50.00% | 1 to 1 |
| Roll an odd number | 3 of 6 | 50.00% | 1 to 1 |
| Roll 4 or higher | 3 of 6 | 50.00% | 1 to 1 |
| Roll 5 or higher | 2 of 6 | 33.33% | 2 to 1 |
| Roll a 1 or a 6 | 2 of 6 | 33.33% | 2 to 1 |
🔁At Least One Value by Dice Count
| Dice (N) | 1 − (5/6)^N | At Least One | Miss All |
|---|---|---|---|
| 1 die | 1 − 0.8333 | 16.67% | 83.33% |
| 2 dice | 1 − 0.6944 | 30.56% | 69.44% |
| 3 dice | 1 − 0.5787 | 42.13% | 57.87% |
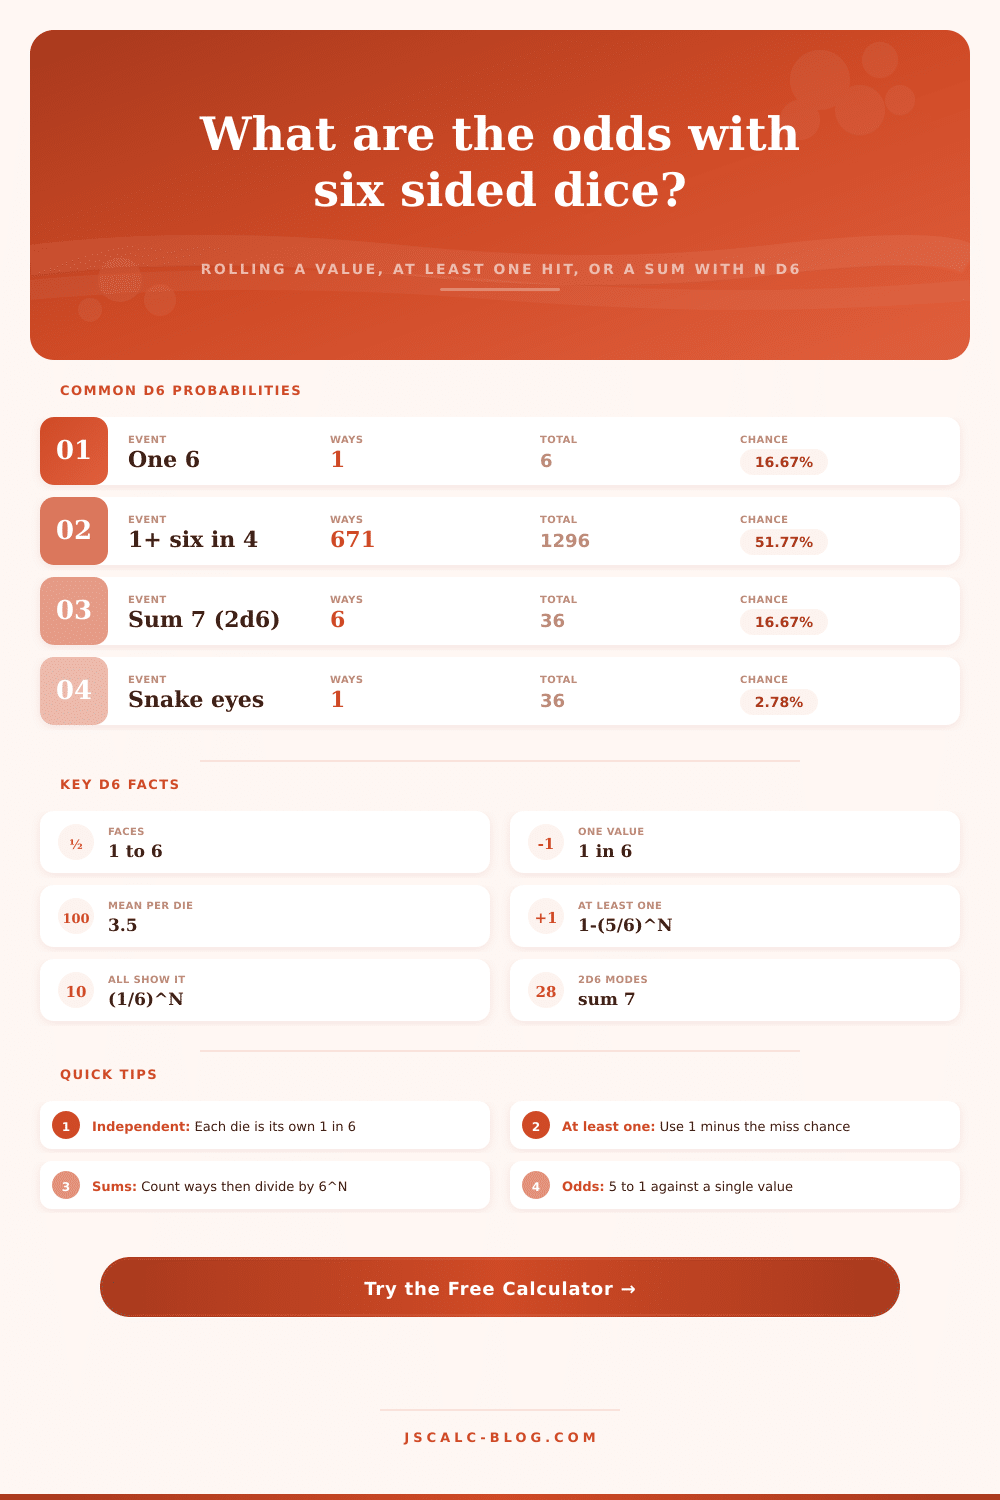
| 4 dice | 1 − 0.4823 | 51.77% | 48.23% |
| 5 dice | 1 − 0.4019 | 59.81% | 40.19% |
| 6 dice | 1 − 0.3349 | 66.51% | 33.49% |
| 8 dice | 1 − 0.2326 | 76.74% | 23.26% |
🎰Two Dice (2d6) Sum Chart
| Sum | Ways | Probability | Odds Against | Common Name |
|---|---|---|---|---|
| 2 | 1 of 36 | 2.78% | 35 to 1 | Snake eyes |
| 3 | 2 of 36 | 5.56% | 17 to 1 | Ace deuce |
| 4 | 3 of 36 | 8.33% | 11 to 1 | Little Joe |
| 5 | 4 of 36 | 11.11% | 8 to 1 | Fever five |
| 6 | 5 of 36 | 13.89% | 6.2 to 1 | Sixie |
| 7 | 6 of 36 | 16.67% | 5 to 1 | Natural |
| 8 | 5 of 36 | 13.89% | 6.2 to 1 | Eighter |
| 9 | 4 of 36 | 11.11% | 8 to 1 | Nina |
| 10 | 3 of 36 | 8.33% | 11 to 1 | Big Dick |
| 11 | 2 of 36 | 5.56% | 17 to 1 | Yo eleven |
| 12 | 1 of 36 | 2.78% | 35 to 1 | Boxcars |
🗂Dice Count Comparison Grid
| Dice (N) | Total 6^N | P(≥1 six) | P(all sixes) | Mean Sum | Sum Range |
|---|---|---|---|---|---|
| 1 die | 6 | 16.67% | 16.67% | 3.5 | 1 – 6 |
| 2 dice | 36 | 30.56% | 2.78% | 7.0 | 2 – 12 |
| 3 dice | 216 | 42.13% | 0.463% | 10.5 | 3 – 18 |
| 4 dice | 1,296 | 51.77% | 0.077% | 14.0 | 4 – 24 |
| 5 dice | 7,776 | 59.81% | 0.013% | 17.5 | 5 – 30 |
| 6 dice | 46,656 | 66.51% | 0.0021% | 21.0 | 6 – 36 |
| 8 dice | 1,679,616 | 76.74% | 0.00001% | 28.0 | 8 – 48 |
⚙Full Combinatorics Breakdown
📋Expected Values & Ranges
| Dice (N) | Mean (3.5N) | Min Sum | Max Sum | Most Likely Sum |
|---|---|---|---|---|
| 1 die | 3.5 | 1 | 6 | each equal |
| 2 dice | 7.0 | 2 | 12 | 7 |
| 3 dice | 10.5 | 3 | 18 | 10 or 11 |
| 4 dice | 14.0 | 4 | 24 | 14 |
| 5 dice | 17.5 | 5 | 30 | 17 or 18 |
| 6 dice | 21.0 | 6 | 36 | 21 |
💡Practical Dice Tips
When you roll a die, the result seems arbitrary. But there is an underlying math that dictates its outcome. For hundreds of years, mathematicians have plotted out this pattern and so have game designers. It’s not necessary to be a stats nerd to grasp it. Simply learn what to ask yourself about dice before you let go.
The misconception around multiple dice is that most folks fail to understand how probability scale. It is additive, not multiplicative. Add an additional die and they expects it to contribute some flat amount to the overall probability. Nope. Probabilities scale multiplicatively. Want to figure out what the chances are you roll at least one 6 with four dice? Well don’t go multiplying 16% times four. You’ve got to consider all the possibilities. Plug in number of dice and the target number in the calculator above and let it do the work for you. No more guesswork with complex fractions and combinatorial expansions. And, it will also help you see difference between achieving a particular sum versus reaching a certain threshold.
How Dice Probabilities Work
Both goals are quite different in terms of table top gaming. The problem with that is: in games where you roll for attack bonuses or damage, the shape of the distribution matter more than the average. If you have a single six-sided die, then all of the numbers (one through six) each has an equal chance at coming up. Each side is flat. But if you add another die, you begin to see some bunching around the middle. The most likely result will be seven. Add yet another and things get tighter still.
Why? Because if you use just one die at its actual size, you’re going to get a lot more wild swings, higher highs and lower lows. Instead of throwing a single six-sided die for damage, you throw multiple dice to reduce variance. Or you throw two dice and multiply by five to get your bonus. Either way, you end up with less variance. There is less unpredictability on either side of the table. There are fewer wild spikes to the sky, but also fewer gut-wrenching crashes to the floor. It is a tradeoff between stability and excitement.
One error many people commit is forcing a number. If I got three ones, then the next roll “has” to be a six or something. But dice aren’t keeping score. Every roll is independent from every other one. What happened previously has no effect on what happens now with the plastic cubes. That’s the purest example of the gambler’s fallacy.
People who believe this make bad strategy choices in games where resources need to be managed over time. Because you feel like you’re on a hot streak, you push too far and try to roll the dice on a risky action when the odds haven’t changed since the start of the game. The “at least one” condition also becomes useful when dealing with critical hits or character creation. This allows you to determine the odds of a specific face appearing anywhere in your pool. Even with two dice, the odds of rolling a six is under one-third. To increase those odds past 50% requires four dice. Which matters since that’s what you need to be able to say: “I’m more likely to roll this than I am to fail.” This makes it easier to make an informed decision about playing it safe or taking a gamble.
Longer campaigns can also mean thinking about expected value. On average, each six sided die result in three and a half points over time. Multiply that by the number of dice you’re rolling. This gives you a good baseline for what to expect on average across hundreds of turns. There will always be short term variance. Sometimes you’re going to go for an hour and roll low. But day after day after day, those numbers starts to gather around that average. It’s one way that games make sure their economies are balanced, and that someone doesn’t stay ahead forever because they got lucky with their die rolls.
You can see them all spelled out on the page in a reference table. This makes it easy to match up your various dice pool combinations and avoid having to recalculate every single one from scratch every time. And it also shows just how rapidly things scale up when you increase the number of variables. Increasing your dice by one might double your odds. That’s why choices matter, and something like going for three instead of two isn’t just a little adjustment; it fundamentally changes the odds of getting what you want.
In the end, what matters is that being aware of the odds alters your perception of the roll. Instead of viewing bad luck as a failure on your part, you view it as random statistical noise. Decide when to make a risky decision based off mathematics, rather than stubbornness. You could of decided earlier. The dice will continue to clatter about with randomness. They will surprise you by landing in unexpected places. Only this time, you’ll know precisely why.