Z-Score Percentile Calculator
Convert a z-score into its percentile rank, and convert a percentile back into a z-score with the inverse normal (probit). Add a mean and standard deviation to translate raw test scores in either direction.
🎯Quick Presets
📝Conversion Inputs
Below is the standard percentile rank; above is the top-percent view.
Used in Z → Percentile mode.
Used in Percentile → Z mode.
In Z mode a raw x overrides z as (x − µ) / σ.
🔢Key Symbols
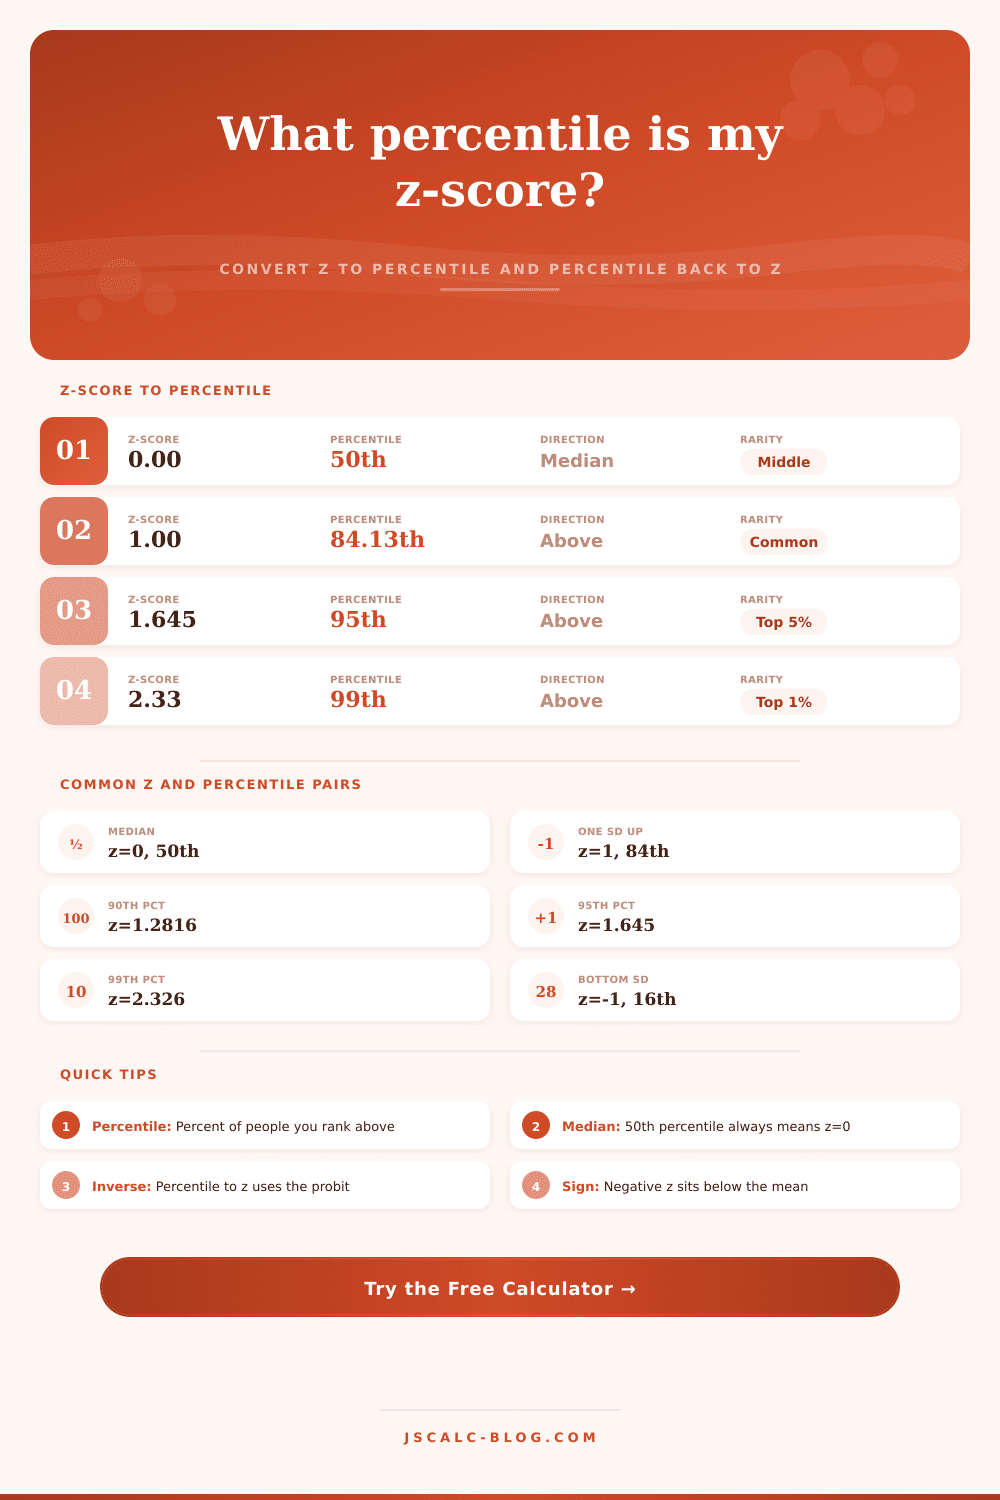
📊Z-Score to Percentile Table
| Z-Score | Percentile Below | Percent Above | Position |
|---|---|---|---|
| −3.00 | 0.13th | 99.87% | Far bottom |
| −2.00 | 2.28th | 97.72% | Low 2.5% |
| −1.00 | 15.87th | 84.13% | Below mean |
| 0.00 | 50.00th | 50.00% | Median |
| 0.50 | 69.15th | 30.85% | Above mean |
| 1.00 | 84.13th | 15.87% | Top sixth |
| 1.645 | 95.00th | 5.00% | Top 5% |
| 2.00 | 97.72th | 2.28% | Top 2.5% |
| 2.33 | 99.00th | 1.00% | Top 1% |
| 3.00 | 99.87th | 0.13% | Far top |
🔄Percentile to Z-Score Table
| Percentile | Z-Score | Tail Above | Note |
|---|---|---|---|
| 1st | −2.3263 | 99% | Bottom 1% |
| 5th | −1.6449 | 95% | Bottom 5% |
| 10th | −1.2816 | 90% | First decile |
| 25th | −0.6745 | 75% | Lower quartile |
| 50th | 0.0000 | 50% | Median |
| 75th | 0.6745 | 25% | Upper quartile |
| 90th | 1.2816 | 10% | Top decile |
| 95th | 1.6449 | 5% | Top 5% |
| 97.5th | 1.9600 | 2.5% | Common CI edge |
| 99th | 2.3263 | 1% | Top 1% |
🧮Z vs Percentile vs Rarity Grid
| Z-Score | Percentile | Percent Above | Odds Above | Rarity | Rough Rank |
|---|---|---|---|---|---|
| −2.00 | 2.28th | 97.72% | ~1 in 1.02 | Well below | Bottom 2.5% |
| −1.00 | 15.87th | 84.13% | ~1 in 1.19 | Below average | Lower sixth |
| 0.00 | 50.00th | 50.00% | 1 in 2 | Exactly typical | Middle |
| 0.67 | 75.00th | 25.00% | 1 in 4 | Upper quartile | Top 25% |
| 1.00 | 84.13th | 15.87% | ~1 in 6.3 | Above average | Top sixth |
| 1.28 | 90.00th | 10.00% | 1 in 10 | Top decile | Top 10% |
| 1.645 | 95.00th | 5.00% | 1 in 20 | Notably high | Top 5% |
| 2.00 | 97.72th | 2.28% | ~1 in 44 | Rare | Top 2.5% |
| 2.33 | 99.00th | 1.00% | 1 in 100 | Very rare | Top 1% |
| 3.00 | 99.87th | 0.13% | ~1 in 741 | Extreme | Top 0.15% |
🎓IQ and Test Score Examples
| Scale | Mean / SD | Raw Score | Z-Score | Percentile |
|---|---|---|---|---|
| IQ (Wechsler) | 100 / 15 | 130 | 2.00 | 97.72th |
| IQ (Wechsler) | 100 / 15 | 115 | 1.00 | 84.13th |
| SAT total | 1050 / 200 | 1300 | 1.25 | 89.44th |
| ACT composite | 21 / 5.4 | 27 | 1.11 | 86.65th |
| GRE section | 150 / 8.5 | 160 | 1.18 | 88.10th |
| T-score scale | 50 / 10 | 70 | 2.00 | 97.72th |
⚙Full Formula Breakdown
📋Reference Values
| Item | Value | Meaning | Where It Shows Up |
|---|---|---|---|
| Φ(0) | 0.5000 | Half the area below the mean | Median, 50th percentile |
| Φ(1) | 0.8413 | One SD above the mean | 84.13th percentile |
| z for 95th | 1.6449 | One-sided 95% cut point | Top 5% threshold |
| z for 97.5th | 1.9600 | Two-sided 95% CI edge | Confidence intervals |
| z for 99th | 2.3263 | One-sided 99% cut point | Top 1% threshold |
💡How to Read Percentiles
Once you submit your answer, the z-score percentile calculator will tell you what your test result was in terms of percentile. That’s because we’re left waiting with a score (just one number with no context). The z-score percentile calculator takes your score and turns it into a common measurement by changing standardized deviations into percentiles, meaning you can see how well you did compared to everyone else who took the same test. Plus, you can enter different standard deviation and mean value for whichever distribution you’d like.
A z-score is a measurement of how many standard deviations away from the mean you are. Your z-score will be zero if you get a raw score that lands on the mean itself. That means you’re in the 50th percentile; you scored better then half the population and worse than the other half. Because of this, it can be confusing for test takers, since farther out from the middle, more points translate into smaller changes in rank (e.g. Small gains in raw score yield diminishing returns in percentile rank).
How Z-Scores Help You Understand Your Test Results
Going from the 25th to the 30th percentile only requires about 1/2 point increase on a typical SAT or ACT. The calculator map these ranks correctly using cumulative distribution function. Here’s an example: What if I scored one standard deviation above the mean? My z-score would be a positive one, which doesn’t put me into top ten percent of the group. Because the bulk of the data huddles right around the middle, it put me roughly in the eighty-fourth percentile. To reach the top sixteen percent means only a slight deviation from the mean. At the high end of the curve, where there isn’t much space to begin with, tiny improvements in your raw score translate into less of an improvement in your percentile rank.
This isn’t about memorizing an output: it’s about understanding what goes into it. Switching to calculating the z-score given a certain percentile… Say, the ninetieth, uses its inverse normal function, working backwards. How many standard deviations above average do you has to be to surpass 90% of the population? It is about one point two eight. This demonstrates that reaching the first quartile from the middle takes much less skill than increasing your rank by six percent, as measured against total population.
Another thing to note: Are you looking at the cumulative area below or above your score? By default the calculator is likely set to the first one, that is, the percentage of people whose result was less than yours. That’s what most people mean when they use “percentile rank.” Sometimes, however, you’ll want to know number of people with a greater score. In this situation, the score represents one tail-end of a distribution. It becomes important to know where the other end begins. For instance, a z-score of approximately one point six four five (the value separating the top 5 percent from everyone else) indicate a result that is statistically rare. These critical values are easy to see on reference tables accompanying the calculator.
Without that statistical information, raw scores are not particularly helpful. If the average (mean) is low and the spread (standard deviation) is narrow, then a score of one hundred fifty may put you into an elite group even though a hundred fifty sounds low for a test with a maximum of two hundred. With the help of this calculator, you can enter in the mean and spread for any other population and your own actual score to get an idea of how far above or below average you really are. It will normalize whatever data is used so that you’re able to compare various kinds of tests, IQ tests vs. One example is SAT scores. This also helps give some context to how well or poorly you are doing.
It replaces an arbitrary number with a relative position on a common curve, so you can have a sense of what it means to be one standard deviation away versus two. Those differences becomes more concrete and immediate in the calculator. That’s where the real information lies. Look beyond the raw number at distance from the mean.