Vancomycin Half-Life Calculator
Estimate the vancomycin elimination half-life from renal function using creatinine clearance, volume of distribution, and drug clearance. Also shows the rate constant k, remaining percent at a chosen time, and a suggested dosing interval bucket. Educational population estimate only.
💉Real Patient Presets
📝Patient and Dose Inputs
Used only when source is set to manual.
Typical vancomycin Vd is 0.6–0.9 L/kg.
Vancomycin CL is about 0.65–0.75 × CrCl.
🔢Formula Snapshot
⚙Full Formula Breakdown
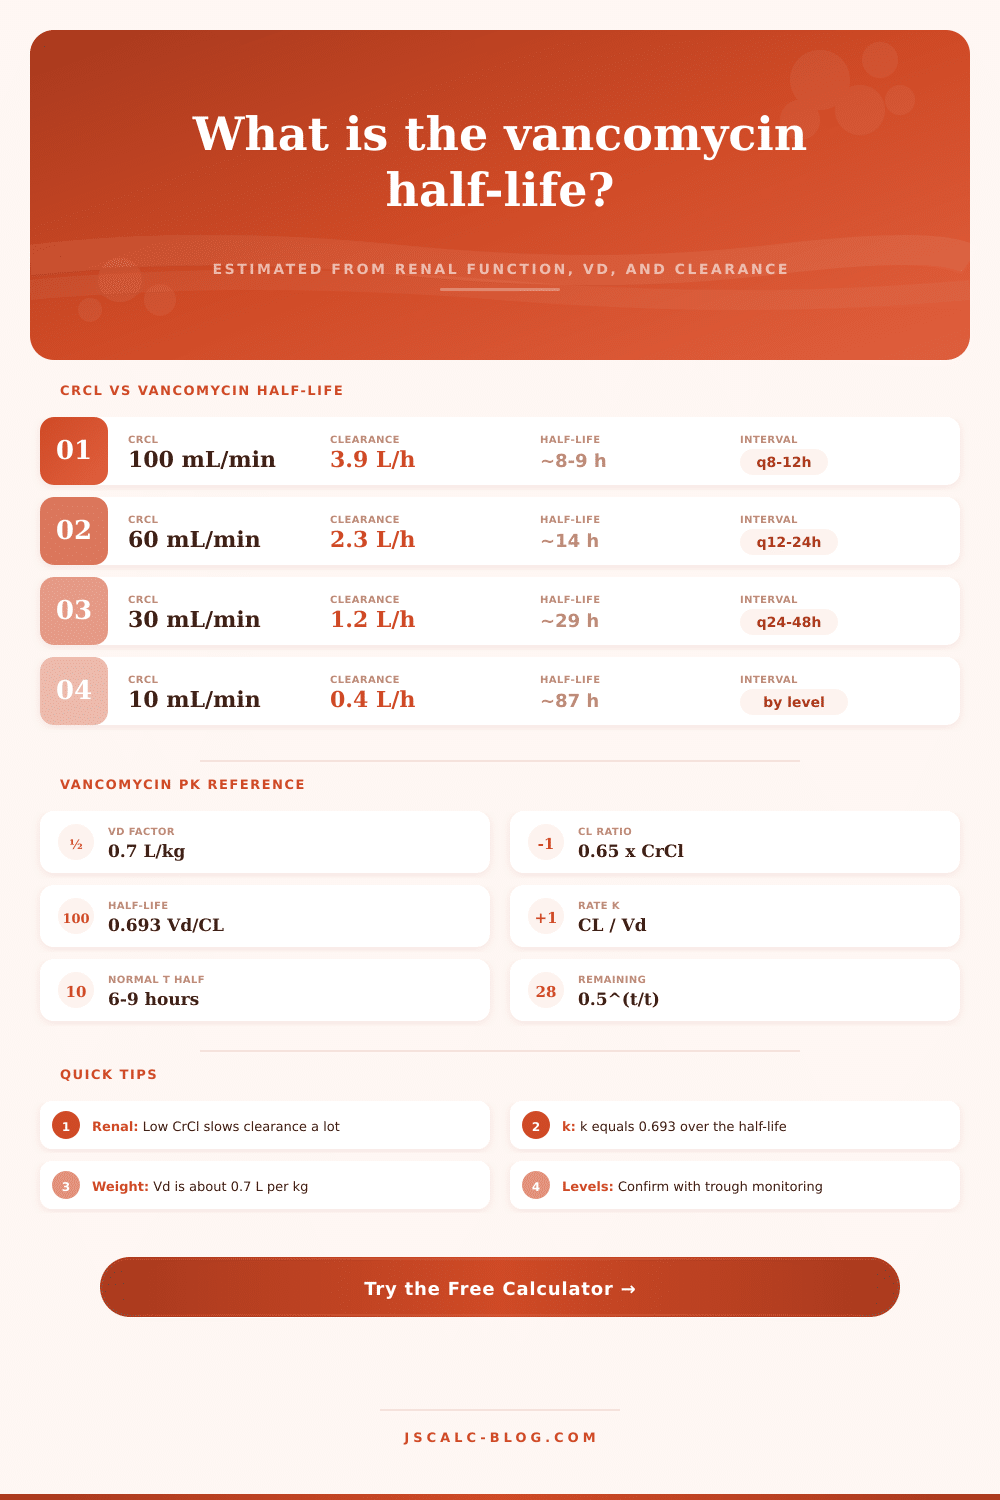
📊CrCl vs Half-Life Comparison
| CrCl (mL/min) | Clearance (L/h) | Half-Life (h) | Rate k (1/h) | Renal Category | Suggested Interval |
|---|---|---|---|---|---|
| 120 | 4.68 | 7.3 | 0.095 | Augmented | q8h |
| 100 | 3.90 | 8.7 | 0.080 | Normal | q8–12h |
| 80 | 3.12 | 10.9 | 0.064 | Normal | q12h |
| 60 | 2.34 | 14.5 | 0.048 | Mild | q12–24h |
| 45 | 1.76 | 19.3 | 0.036 | Moderate | q24h |
| 30 | 1.17 | 29.0 | 0.024 | Moderate | q24–48h |
| 20 | 0.78 | 43.5 | 0.016 | Severe | q48h |
| 10 | 0.39 | 87.0 | 0.008 | Failure | By level |
Values assume a 70 kg adult, Vd 0.7 L/kg (49 L), and CL = 0.65 × CrCl. Individual results vary with weight and Vd.
🗂Dosing Interval by Renal Function
| Renal Function | CrCl Band | Typical Half-Life | Empiric Interval | Monitoring Note |
|---|---|---|---|---|
| Augmented clearance | ≥ 130 | 6–7 h | q6–8h | May under-dose without checks |
| Normal | 90–129 | 7–9 h | q8–12h | Standard trough or AUC |
| Mild impairment | 60–89 | 9–14 h | q12h | Watch trend |
| Moderate impairment | 30–59 | 14–29 h | q24h | Extend interval |
| Severe impairment | 15–29 | 29–58 h | q48h | Level-guided |
| Renal failure / HD | < 15 | > 58 h | By level | Redose on measured trough |
📋Vd and Clearance Reference
| Parameter | Typical Value | How It Is Used | Effect on Half-Life |
|---|---|---|---|
| Vd factor | 0.6–0.9 L/kg | Vd = factor × weight | Higher Vd lengthens half-life |
| Body weight | 50–120 kg | Scales total Vd | More weight, larger Vd |
| CL ratio | 0.65–0.75 | CL = ratio × CrCl | Higher CL shortens half-life |
| CrCl | 10–130 mL/min | Drives clearance directly | Low CrCl greatly extends it |
| Rate constant k | 0.008–0.10 /h | k = CL / Vd | k = 0.693 / half-life |
🩺Renal Function Categories
| Category | CrCl (mL/min) | Relative Clearance | Half-Life Trend | Interval Trend |
|---|---|---|---|---|
| Augmented | ≥ 130 | Very high | Shortest | Shortest interval |
| Normal | 90–129 | High | Short | Standard interval |
| Mildly reduced | 60–89 | Moderate | Longer | Slightly extended |
| Moderately reduced | 30–59 | Low | Long | Extended |
| Severely reduced | 15–29 | Very low | Very long | Widely spaced |
| Kidney failure | < 15 | Minimal | Prolonged | Level-guided only |
💡Practical Half-Life Tips
For example: Vancomycin is used for persistent bacterial infections, but has to be administered precisely; an error could do more harm then good. To know when vanco clears from system, you have to understand its half life. Without knowing that, you don’t know if you’re giving too much (and putting yourself in danger of kidney toxicity) or not enough.
Until now, this required a visit to specialist or complex software; with this app, however, all they need are the patient weight and renal function, and it’ll return a ballpark estimate based off simple population averages. It calculates your dosage and then converts those abstract clearance rates into real-world dosing interval.
How to Use Vancomycin Safely
Because vancomycin is nearly completely excreted through kidney filtering, kidneys take center stage in this dance. Drug elimination directly reflects renal function. Sluggish kidneys = long drug duration. Hyper-active ones (as may be found in ICU patient) = rapid drug loss.
Without a measure of clearance, the tool rely on an estimation via the Cockcroft-Gault equation. The calculation is adjusted for sex, weight, and age. So again, it’s a rough approximation, but it’s what we need as a starting point. Plug in the patient’s demographics and their serum creatinine, the rest is calculated from those values.
The other side of the equation are volume of distribution. Volume of distribution is the parameter that shows how extensively the drug will spread throughout tissues (versus remaining within the blood plasma). In vancomycin’s case, it distribute to extracellular fluid and thus, generally speaking, the bigger you are, the more room there is for the drug to occupy.
By default, the calculator use a standard factor of 0.7 liters/kg, and this serves well for most adult patients. But we’re dealing with clinical nuance here. Patients with severe edema or obesity might have a higher volume of distribution. That is, the same dose result in lower initial concentration levels. Adjusting that factor in the calculator help us better reflect reality instead of just sticking to defaults.
After setting clearance and volume, do some math to get the half life. It’s usually somewhere between six and nine hours in otherwise healthy adults. That changes with renal function. As creatinine clearance drops below 30 milliliters per minute, the half-life increase to nearly thirty hours. It is not because it’s linear but because it slows exponentially.
The drug doesn’t metabolize more slowly; it just takes longer for each dosage to have an effect. That means you don’t reduce the dose, you increase the interval. And the recommended intervals expands on the reference chart from every eight hours to every forty-eight hours for those with impaired kidney function.
Another way to think about rate of elimination is to consider the rate constant (k), which is the fraction of the drug lost every hour. The higher the number, the faster it go away. The lower the number, the slower it goes away and the more it will hang around. Knowing that can help you estimate what portion of the drug still remain at a certain point in time.
For example, if you get a trough level at 12 hours post-dose, knowing the half-life can tell you whether that concentration is therapeutically effective or potentially dangerous. The calculator shows you the percent remaining so you can immediately feel out your exposure and don’t have to break out the graph paper to plot a curve.
No matter what your estimate, keep an eye on things. Though population models may be your starting point, each individual vary. So always double check these estimates against actual serum levels. If you want trough monitoring or if you want to target area-under-the-curve then make sure that the estimated half-life from theory matches up with the half-life in the patient’s body.
Hit this sweet spot between being effective and being safe. Time it just right so that you have cleared the infection without doing damage to kidneys. Miss the mark and you risk not clearing the infection (treatment failure) or risking toxicity. It is all about knowing when the drug exits the body, it should of been done carefully.
You could of also checked levels sooner. Actualy, a moddern app makes it easier. Just make sure you recieve the right data.