Sample Size for Comparing Two Proportions Calculator
Plan two independent proportion groups with expected rates, alpha, power, allocation ratio, and dropout inflation.
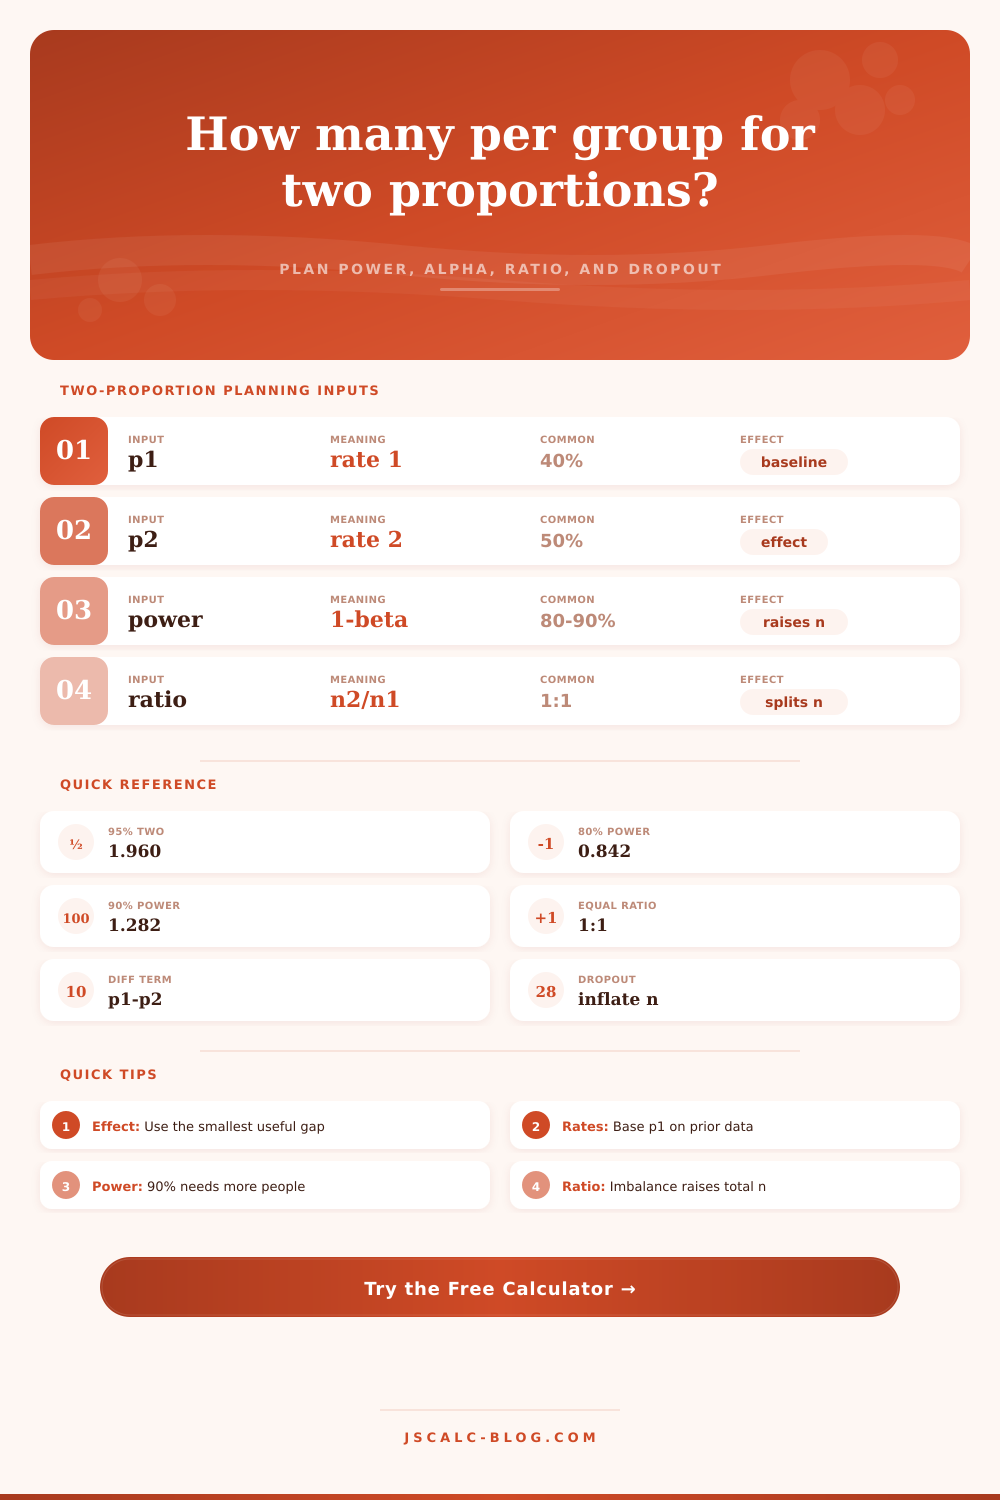
Usually the control, baseline, or current process rate.
Usually the treatment, variant, or improved process rate.
Two-sided uses z alpha/2, matching most comparative protocols.
Use 1 for equal groups, 2 for twice as many in group 2.
Enrollment is inflated after the analyzed sample size is computed.
Separate rounding is conservative; pair rounding keeps ratios tidier.
| Planning choice | Probability statement | z value | Sample-size effect |
|---|---|---|---|
| 90% confidence, two-sided | alpha = 0.10, alpha/2 = 0.05 | 1.6449 | Smallest common two-sided setting |
| 95% confidence, two-sided | alpha = 0.05, alpha/2 = 0.025 | 1.9600 | Most common default |
| 99% confidence, two-sided | alpha = 0.01, alpha/2 = 0.005 | 2.5758 | Substantially larger n |
| 80% power | beta = 0.20 | 0.8416 | Common planning minimum |
| 90% power | beta = 0.10 | 1.2816 | Stronger study planning |
| 95% power | beta = 0.05 | 1.6449 | Large-sample demanding |
| Scenario | p1 | p2 | Difference | Approx equal n at 95% and 80% |
|---|---|---|---|---|
| Very small conversion lift | 5% | 6% | 1 point | About 8,150 per group |
| Small conversion lift | 10% | 12% | 2 points | About 3,840 per group |
| Moderate process change | 20% | 25% | 5 points | About 1,090 per group |
| Balanced response gap | 40% | 50% | 10 points | About 388 per group |
| High baseline improvement | 70% | 78% | 8 points | About 471 per group |
| Rare adverse event screen | 1% | 0.5% | 0.5 point | About 4,670 per group |
| Ratio n2/n1 | Group 1 analyzed | Group 2 analyzed | Total analyzed | Comparison note |
|---|---|---|---|---|
| 0.50 | Calculates live | Calculates live | Calculates live | Useful when group 2 is scarce |
| 1.00 | Calculates live | Calculates live | Calculates live | Efficiency baseline |
| 2.00 | Calculates live | Calculates live | Calculates live | More group 2 outcome data |
| 3.00 | Calculates live | Calculates live | Calculates live | Larger total sample expected |
| Preset | p1 | p2 | Alpha | Power | Ratio | Dropout | Typical use |
|---|---|---|---|---|---|---|---|
| A/B signup lift | 12% | 14% | 5% | 80% | 1:1 | 5% | Digital experiment |
| Clinical response | 40% | 52% | 5% | 90% | 1:1 | 12% | Trial protocol |
| Defect reduction | 8% | 5% | 5% | 80% | 1:1 | 3% | Quality audit |
| Vaccine uptake | 55% | 65% | 5% | 90% | 1.5:1 | 8% | Community program |
| Churn retention | 18% | 15% | 5% | 80% | 1:1 | 10% | Retention test |
| School pass rate | 72% | 80% | 5% | 85% | 1:1 | 6% | Education outcome |
| Rare event safety | 1% | 0.5% | 5% | 80% | 2:1 | 5% | Safety monitoring |
| Small margin screen | 48% | 52% | 5% | 90% | 1:1 | 10% | Fine difference |
| 2:1 recruitment | 30% | 38% | 5% | 80% | 2:1 | 15% | Unequal enrollment |
I have a hunch my new web design is doing better then the old one. I feel that my new email subject lines are cutting down on the deletes. It’s intuitive, but the boardroom requires more than intuition. It requires a specific number of people to test, at which point you can stop guessing.
Sample size calculation do exactly this. They bridge the gap between your optimistic guess and a statistically significant result. The calculator does all the heavy lifting for you, but knowing what drives the calculation will prevent you from running a study with three thousand people when three hundred will do.
How to Find the Right Number of People for Your Study
When you compare two proportions, it’s all about the difference: Your expected improvement minus what you already have. That’s effect size. Suppose you’re currently signing up 10% of shoppers; you’d like to sign up 12%. The gap is only two points. Small differences in rates require large samples, because they’re easy to miss amid the normal variations in human behavior.
A ten-point improvement? That drastically reduces the sample size. Instead, you are measuring delta itself. Most people underestimate this point: As your delta shrinks, your sample size balloons, and it’s not even remotely linear. Doubling your existing rate will not halve your sample size (it’ll decrease by less than half). In fact, if you want to cut your delta in half, you’ll typically need to quadruple your sample size.
Next comes: how confident do you need to be? That’s a question about the balance of power and alpha. Alpha is your willingness to accept a false positive, meaning you say there is a difference where none actualy exists. The standard default across industries are a five percent error rate, which means you are willing to take a 1-in-20 risk of being incorrect.
On the other hand, you have your power, or how likely it is that you will find a difference when there really is one. Common levels are 80 percent, though it is safer to go up to 90 percent if missing out on something is costly. Lowering alpha and increasing power both increase the sample size (because you’re buying certainty from participants).
It’s always a tradeoff between the cost of a more lengthy study vs. There is a potential risk of concluding incorrectly.
In real world studies, there is no clean data. Surveys aren’t answered, links are broken, people drop out. To account for this, the tool has a dropout inflation setting. For example, if you think you’ll require one-hundred surveyed responses per group, yet expect ten percent attrition, then you can’t simply recruit one-hundred. You must enroll more because the calculator will inflate your enrollment target so that you can reach your studied number despite inevitable losses.
It’s a classic mistake to ignore this step, it makes studies underpowered when they’re most in need of being robust.
A second lever to pull is allocation ratios. Statistically speaking, equal groups is most powerful (for any given total number of samples), so they are statistically efficient. But practically speaking, you may not be able to recruit equally. Perhaps the control group want extra safety data, or perhaps the treatment is difficult to source. This isn’t an issue: unequal allocation does work.
As the ratio moves further from one-to-one, however, the total sample size increase. Efficiency gives way to practicality. It’s a little thing, but when each participant represents time or money, it does matter.
You can see how this changes by industry with the presets on the page. For an A/B test of a landing page, you may be willing to accept lower power, or more alpha, if it means getting results quicker. For a clinical trial, you’d need very strict alpha levels. You would also probably want a lot of people enrolled so the study could be huge.
It doesn’t mean there’s one right answer. There’s just whatever answer fits your resources and risk tolerance. When you input your constraints and how fast you want to work, the equation will give you clear answers.
Exactly how many people should you shoot for? You don’t guess anymore. You plan. And the numbers help you understand where you’re going, and how to get there.