Sample Size With Finite Population Calculator
Plan completed responses, invite counts, finite population correction, and achieved margin of error using Cochran's proportion formula on JSCalc-Blog.com.
📌Finite Population Presets
🧮Sample Size Inputs
Used for context notes and preset assumptions.
Higher confidence increases the required sample.
Count only eligible people or units in the frame.
Use 50% when you do not know the expected result.
This is the plus-or-minus target for the estimate.
Invite count equals completed sample divided by response rate.
Leave at 1.00 for ordinary random or census-style outreach.
Planning usually rounds upward so the target is not undercut.
Formula Breakdown
📋Current Case Summary
📐Confidence Level Reference
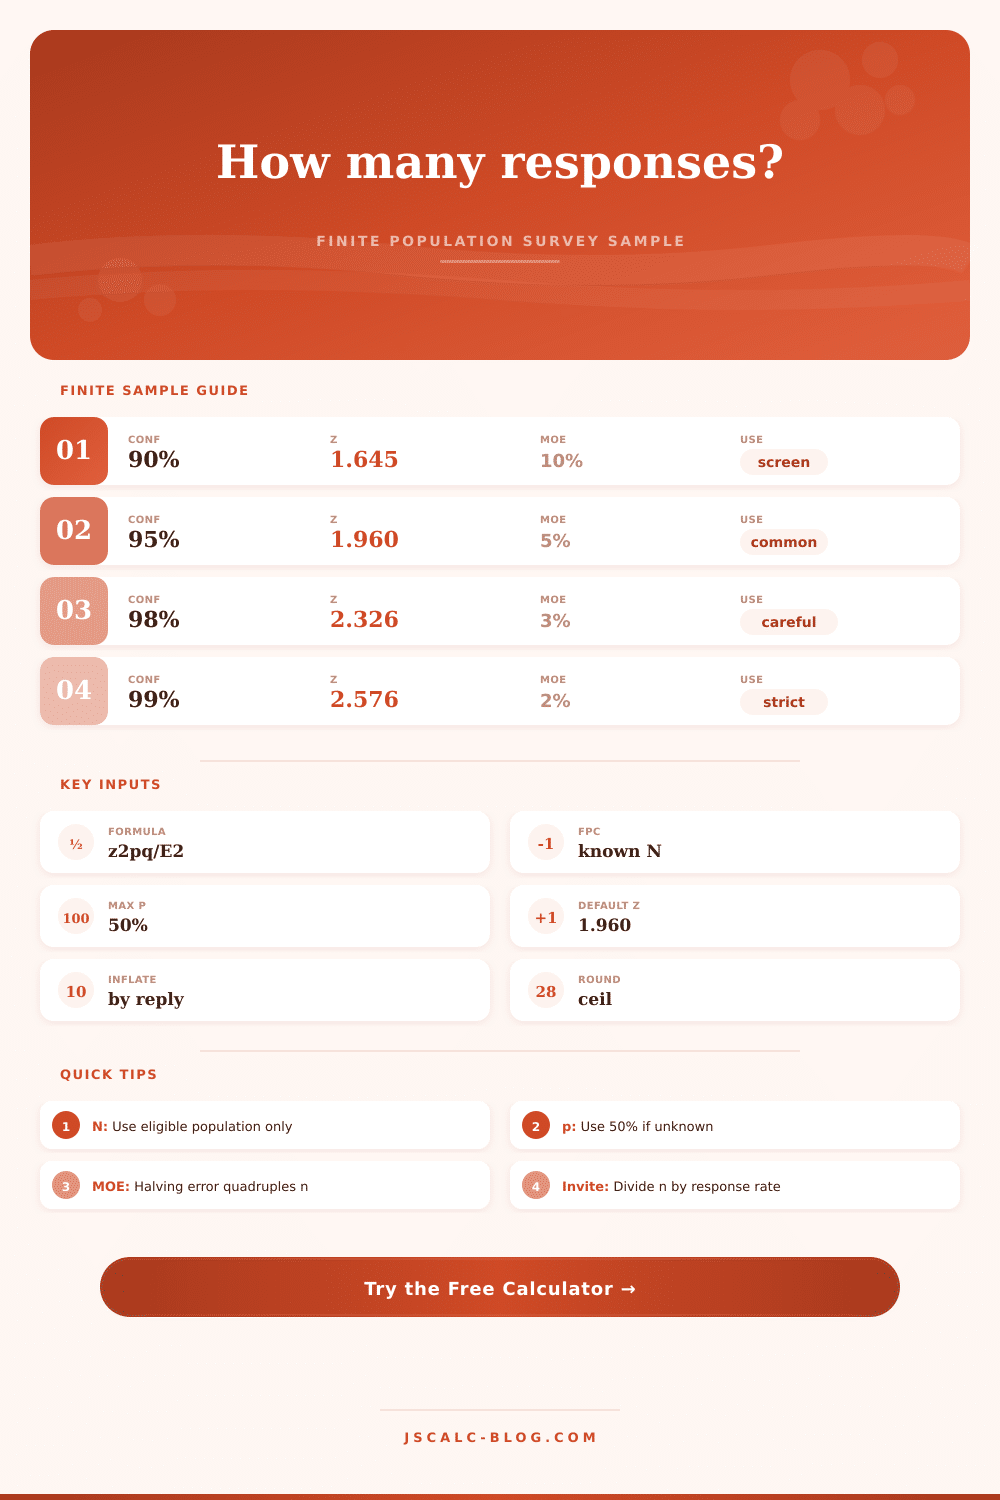
| Confidence | z Value | Typical Use | Sample Impact | Note |
|---|---|---|---|---|
| 90% | 1.645 | Early screening | Smallest of these options | Accepts more uncertainty |
| 95% | 1.960 | Standard survey reporting | Common baseline | Good default for many studies |
| 98% | 2.326 | Higher-stakes estimate | About 41% above 95% | Useful when misses are costly |
| 99% | 2.576 | Strict interval planning | About 73% above 95% | Needs a much larger n |
📊Finite Population Sample Examples
| Population N | 95% / 5% | 95% / 3% | 99% / 5% | FPC Importance |
|---|---|---|---|---|
| 100 | 80 | 92 | 87 | Very high |
| 250 | 152 | 203 | 183 | Very high |
| 500 | 218 | 341 | 286 | High |
| 1,000 | 278 | 516 | 400 | High |
| 5,000 | 357 | 880 | 586 | Moderate |
| 10,000 | 370 | 965 | 623 | Moderate |
| 100,000 | 383 | 1,056 | 659 | Low |
| Unlimited | 385 | 1,068 | 664 | None |
📨Response-Rate Inflation Table
| Completed Target | 80% Response | 60% Response | 40% Response | 25% Response | Planning Note |
|---|---|---|---|---|---|
| 100 | 125 invitees | 167 invitees | 250 invitees | 400 invitees | Smaller panels can support this |
| 200 | 250 invitees | 334 invitees | 500 invitees | 800 invitees | Watch finite population coverage |
| 300 | 375 invitees | 500 invitees | 750 invitees | 1,200 invitees | Often needs reminder waves |
| 400 | 500 invitees | 667 invitees | 1,000 invitees | 1,600 invitees | May become a census attempt |
| 600 | 750 invitees | 1,000 invitees | 1,500 invitees | 2,400 invitees | Check frame size before launch |
| 1,000 | 1,250 invitees | 1,667 invitees | 2,500 invitees | 4,000 invitees | Use staged follow-up plans |
⚙Formula And Method Checks
Cochran base sample: n0 = z2 x p(1 - p) / E2. This gives the completed sample for a very large population.
Finite population correction: n = n0 / (1 + (n0 - 1) / N). This is the standard FPC adjustment when the population size is known and sampling is without replacement.
Response-rate inflation: invitations = completed sample / response rate. The calculator rounds after FPC and again after response planning so outreach targets stay practical.
🔍Study Context Reference
| Context | Typical Frame | Common Response | p When Unsure | Design Effect | Main Watchout |
|---|---|---|---|---|---|
| Customer or user list | Known account base | 20% to 45% | 50% | 1.00 to 1.10 | Recent users may differ from inactive users |
| Employee population | Roster or department | 55% to 85% | 50% | 1.00 to 1.25 | Departments can cluster opinions |
| Student group | Class, grade, or school | 60% to 90% | 50% | 1.00 to 1.50 | Classroom clusters can matter |
| Association vote | Member roll | 35% to 70% | 50% | 1.00 to 1.10 | Eligibility rules define N |
| Clinic registry | Eligible patients | 25% to 55% | 50% | 1.10 to 1.50 | Nonresponse can be systematic |
| City residents | Adults or households | 10% to 35% | 50% | 1.25 to 2.00 | Weighting often increases variance |
| Alumni or donor file | Reachable contacts | 15% to 40% | 50% | 1.00 to 1.25 | Old contact records lower response |
| Event attendees | Registered attendees | 30% to 65% | 50% | 1.00 to 1.15 | Post-event timing shifts response |
Sample size isn’t something that’s written down in some book. It isn’t a static value. Instead, there is an appropriate number for you based off how precise you need to be and size of the audience you are studying.
For instance, if you’re sending out a survey to all Americans vs. Just your customers, or a small town, then the calculation are different. That’s why adjusting for your group size will save you by avoiding having to do unnecessary interviews, saving you money.
How to Find the Right Sample Size
We do this for you with the calculator above. It use Cochran’s formula to compute a final sample size that fits your particular parameters.
First, you define the scenario: Are you conducting an alumni survey? Are you conducting an employee pulse check? This sets assumptions used in the calculator itself.
Next, select your desired confidence level. Most surveys uses 95 percent as their default (which makes sense); however, if you’re in a situation where stakes is greater, feel free to adjust upward to 99 percent. Note, though, the steep price: To get that additional confidence, you need a lot more people, and that increases cost and time required.
Then comes population size. That’s how many people are eligible for your frame… I.e., the crucial piece that everybody forgets about. If you have a tiny population, fewer than a thousand, perhaps, then the necessary sample size decrease a lot. You don’t have to interview three hundred people if you’re trying to survey a group of two hundred; every subsequent interview represent an increasingly bigger slice of the whole pie, and the mathematics corrects accordingly.
This is where the page’s reference table realy shines. Maybe you just need eighty responses from a population of one hundred? Maybe you need three-hundred-ish from a million? As denominator increases, the correction factor decreases. This explains why big polls can sometimes get away with ignoring it completely, but little surveys cannot.
What’s the likely proportion? You don’t know, so put it at 50 percent. That’s the least accurate guess possible (because a result that breaks down even means there can be lots of variance). The lower you go on this number, for example if you think it’ll be rare, like ten percent; the less sample size you’ll need. And it’s always safer to collect more responses than you might require. Putting it at 50 percent guarantees you never under-estimate how much data you’ll want.
Your precision target is margin of error. A common one is five percent; three percent means you’d have to poll about four times as many people. Most people mess this up by assuming that linear scaling apply. But it doesn’t: Halve the error and you quadruple your work.
The next step is where the calculator will inflate your required sample size by accounting for your anticipated response rate. If only 40 percent of those invited respond, then you’ll need to invite twice as many people at least. This step is important for planning your outreach because it turns a statistical goal into something you can actualy do.
Design effects cause clustering. Are you sampling at the household level? Are you sampling at the department level? That introduce more variability. How do you handle that? You adjust for it in the tool. Even though assumption of simple random sampling has been strained a bit, your confidence intervals will be accurate.
The finishing touches are the rounding rules. Round up. It’s always better to have interviewed one additional person than to discover that your study is underpowered.
Surveying isn’t really about the magic number as much as it’s about finding a balance between practicality and precision. We need to decide how many people to talk to so we can believe the answer, without collecting too many and spending time talking with folks who won’t provide additional insight. That’s where finite population correction will be your friend, once you start sampling an adequate portion of the group, there is diminishing returns from pursuing every single individual in the pool. Let the tool help you determine where this happy medium lies, and then go collect the responses. The math provides the target; your follow-up obtains the data. And don’t forget that it’s not about the number, it’s about a faithful representation of the entire population.