Trading Win Rate Calculator
Measure your trading edge with win rate, risk-reward ratio, expectancy per trade, profit factor, and the break-even win rate your reward-to-risk needs to stay profitable over a series of trades.
🎯Real Trading Presets
📝Trade Inputs
R mode treats average loss as 1R by default.
Only used when source is set to manual RR.
🔢Formula Snapshot
📊Break-Even Win Rate By Risk-Reward
| Risk-Reward (R:1) | Break-Even Win Rate | Safe Target | Meaning |
|---|---|---|---|
| Break-even reference appears after calculation. | |||
📉Expectancy Reference (per 1R risked)
| Win Rate | 1:1 RR | 1:2 RR | 1:3 RR | Read |
|---|---|---|---|---|
| Expectancy grid appears after calculation. | ||||
🧮Profit Factor Bands
| Profit Factor | Rating | What It Signals | Action |
|---|---|---|---|
| Below 1.00 | Losing | Gross losses exceed gross wins | Stop and review the edge |
| 1.00 to 1.24 | Fragile | Barely positive, fees can erase it | Tighten risk and costs |
| 1.25 to 1.49 | Workable | Real but thin edge | Scale slowly, log more trades |
| 1.50 to 1.74 | Good | Consistent, tradable system | Keep sizing disciplined |
| 1.75 to 2.49 | Strong | Robust edge across conditions | Press proven setups |
| 2.50 and up | Elite | Rare, verify sample is large | Guard against overfitting |
🗂Win Rate vs Risk-Reward Trade-Off
| Trader Style | Win Rate | Avg RR | Break-Even | Edge | Expectancy (R) |
|---|---|---|---|---|---|
| High-frequency scalper | 70% | 1:1 | 50.0% | +20.0% | +0.40R |
| Momentum day trader | 55% | 1.5:1 | 40.0% | +15.0% | +0.38R |
| Balanced intraday | 50% | 2:1 | 33.3% | +16.7% | +0.50R |
| Swing trader | 40% | 3:1 | 25.0% | +15.0% | +0.60R |
| Trend / breakout | 33% | 4:1 | 20.0% | +13.0% | +0.65R |
| Position runner | 28% | 5:1 | 16.7% | +11.3% | +0.68R |
| Coin-flip 1:1 | 50% | 1:1 | 50.0% | 0.0% | 0.00R |
| Over-trading trap | 45% | 1:1 | 50.0% | -5.0% | -0.10R |
⚙Full Formula Breakdown
📋Metric Reference Values
| Metric | Common Range | How It Is Used | Edge Signal |
|---|---|---|---|
| Win rate | 30% to 70% | wins ÷ total trades | Compare against break-even, not 50% |
| Risk-reward | 1:1 to 1:5 | reward per unit of risk | Higher RR lowers the win rate needed |
| Expectancy | -1R to +1R | average result per trade | Positive value means a real edge |
| Profit factor | 0.5 to 3.0 | gross wins ÷ gross losses | Above 1.0 is profitable, 1.75+ is strong |
| Risk per trade | 0.5% to 2% | account × risk % | Caps drawdown during losing streaks |
💡Practical Trading Tips
Winning is great and losing stings. It’s natural to begin trading by pursuing high win rates. Maybe you think you need to be right 80% of the time to make money. That thinking will burn a hole in your pocketbook. If you have large losses and small wins, your gut instinct can wreck your account.
In fact, having a forty percent winning percentage won’t stop you from beating someone who has a seventy percent win rate, as long as the risk-reward balance are properly aligned. (See our calculator here.) There’s another piece of the puzzle: it’s not just win rate that matters. It’s also what happens when you lose, versus what happens when you win.
Why You Don’t Need to Win Every Trade
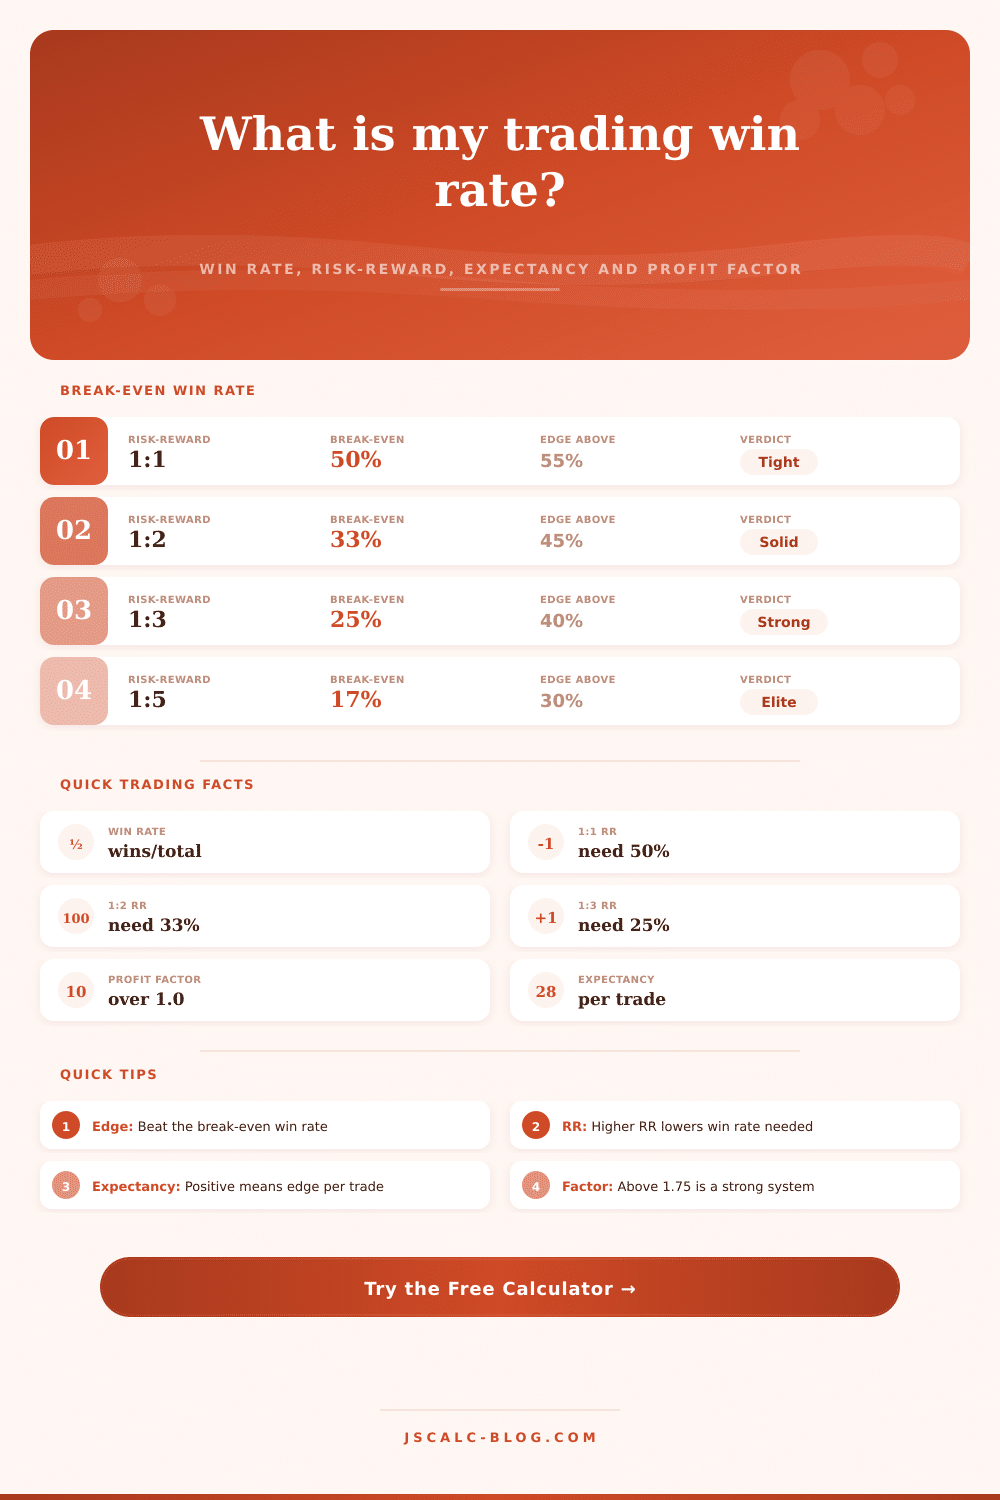
That’s called the risk-reward ratio, where the amount you’re risking per trade is compared against the amount you expect to gain if you’re right. A one-to-two ratio mean I stand to make two-hundred bucks for every one-hundred dollars at risk. With such an arrangement, you don’t have to be right half the time in order to break even. Heck, all you’d have to do is win roughly one-third of your trades. Of course, this is before accounting for fees.
This shift will change minds of those of us who believe we have to be right fifty-five percent of the time or else we’ll fail. How about a scalper who makes quick profits on very small moves? They may has a 90% winning percentage. But it only takes one loss to erase ten winning trades when they don’t stop losses quickly. Their average profit per trade is negative in that situation.
Expectancy is the amount, on average, you can expect to make (or lose) per trade over time. It’s the combination of your risk-reward ratio, your win rate and frequency of outcomes into one dollar figure. If it’s positive, then the odds are in your favor… Even though you think you’re losing a lot. People miss this because they look at how often they win without considering the magnitude of result.
Another profitability measure is called profit factor, which measures gross profit against gross loss. So if you have less than 1 as a profit factor, you’re in the red no matter what day was green. A profit factor of greater than 1.75 typically indicates a solid system that can withstand actual trading expenses. The chart on this page provides a comparison between different styles of traders and their benchmark profit factors.
You’ll notice a trend following style, for instance, will likely only be right 33% of the time. However, they aim for four-to-one reward to risk ratios. This yields a healthy expectation of gains and a high profit factor, despite how much like a losing approach it looks at a quick glance.
But you must be careful not to optimize for vanity metrics. Traders do this by moving their stop loss further out to increase their winning percentage. Taking profit earlier is another. It’s easier on the ego and looks better on chart with more green bars. However, it typically decreases the risk-reward. Sooner or later, you’ll find yourself trading an unprofitable strategy.
Ultimately, it comes down to how much pain you’re willing to suffer. A high win rate approach feels good, it strokes the ego by reinforcing your natural inclination to want to be right. A low win rate approach will challenge your nerve. The math tells you that you’re ahead, but you’ll go through some long losing stretches before you reach that point. Discipline would of been required in large amounts.
Slippage and fees are much bigger deals than most people starting out think they are. There’s a fee on every trade, whether it’s commission, spread, or time to execute a trade. These fees can eat away at even the smallest edge you might have in a short period of time. When you’re plugging numbers in, you can put in an estimate of what you think the fees will be. This gives you a more realistic expectation of how much you could make. It makes you realize that trading isn’t free money; it’s a business and there are overhead costs involved.
Don’t try to win every single trade. Instead, make sure winning trades covers the losing ones and result in a profit for yourself. Develop a system so the winners will more than make up for the losers. When you get to this point in your understanding of the relationship between the two, you no longer worry as much about taking an occasional loss, or even missing on smaller-sized trade.
You’re no longer trying to fight the market, instead, you’re implementing a plan which statistically has an advantage over time. The math doesn’t care what you feel, but it will pay you back if you give it time to work.