Tiered Commission Calculator
Calculate marginal tier payouts, quota attainment, accelerator bands, split credits, holdbacks, draws, and payout caps from one sales compensation model.
⚡ Commission Plan Presets
📋 Plan Inputs
Marginal mode pays each slice of credit at its own rate.
Use the amount eligible for commission before splits and gates.
Use 100 when the plan pays fully after qualification.
Enter any amount held until payment, implementation, or clawback review.
Use 0 for no cap. Example: 3 caps payout at 3x target incentive.
Commission Results
📊 Current Plan Snapshot
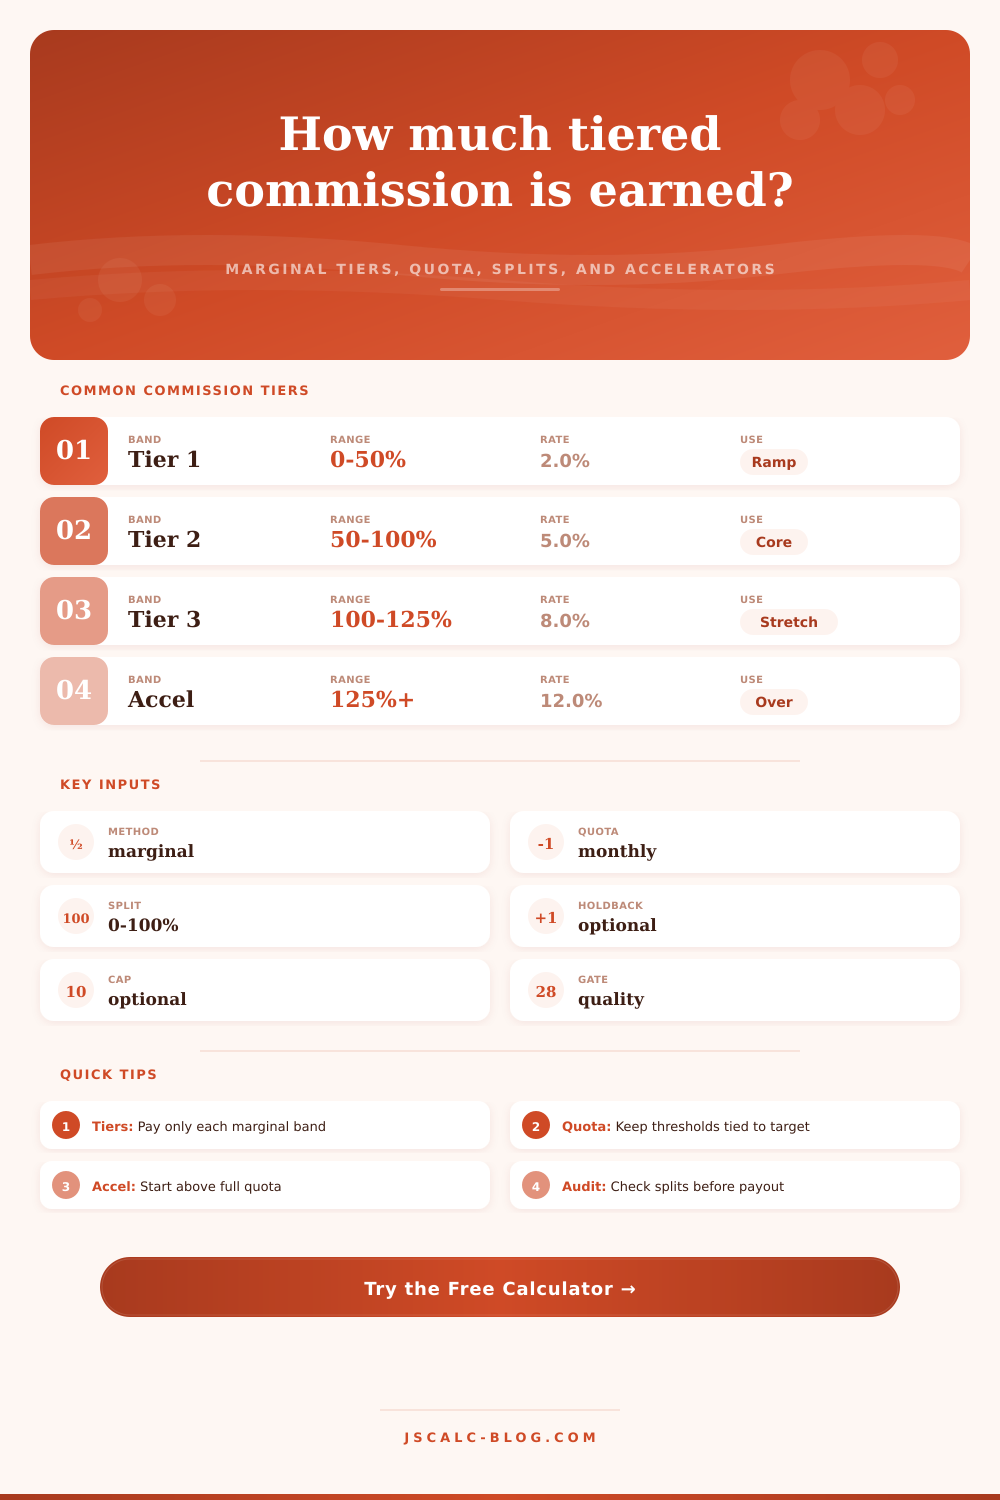
These cards mirror the active inputs so you can see where the marginal bands begin and where the accelerator rate applies.
🧮 Formula Breakdown
Eligible credit = credited amount x split % x eligibility gate %
Tier payout = marginal dollars inside tier x tier rate
Net payable = min(gross commission, cap) - holdback - recoverable draw
| Band | Threshold Formula | Marginal Credit Formula | Rate Source | Typical Purpose |
|---|---|---|---|---|
| Tier 1 | 0 to Tier 1 cap | min(credit, cap1) | Tier 1 rate input | Reduced ramp or floor payout |
| Tier 2 | Tier 1 cap to Tier 2 cap | min(credit, cap2) - cap1 | Tier 2 rate input | Core quota performance |
| Tier 3 | Tier 2 cap to Tier 3 cap | min(credit, cap3) - cap2 | Tier 3 rate input | Stretch payout before acceleration |
| Accelerator | Above Tier 3 cap | credit - cap3 | Accelerator rate input | Over-quota incentive |
📘 Plan Type Reference
| Plan Profile | Basis | Tier Pattern | Accelerator | Common Gate |
|---|---|---|---|---|
| SDR appointment quota | Qualified meetings or points | Low rate to 50%, core to 100% | 110% to 125% | Meeting acceptance |
| SMB account executive | Monthly bookings | 50%, 100%, 125% | 125%+ | Closed-won verification |
| Mid-market sales | Quarterly bookings | 60%, 100%, 130% | 130%+ | Contract and payment status |
| Enterprise sales | Annual contract value | 75%, 100%, 150% | 150%+ | Legal approval or invoice |
| Renewal or retention | Renewed revenue | 80%, 100%, 115% | Expansion above base | Net retention threshold |
| Channel partner split | Partner-assisted bookings | 50%, 100%, 120% | Shared beyond quota | Approved split percent |
| Manager override | Team bookings | Team threshold bands | Team over-performance | Team attainment gate |
| Gross margin based | Gross margin dollars | Lower base, higher stretch | Margin over quota | Margin floor |
🗂 Comparison Grid
| Scenario | Quota | Sales Credit | Attainment | Base Band | Accelerator Band | Review Focus |
|---|---|---|---|---|---|---|
| New rep ramp | 50,000 | 32,500 | 65% | Reduced first tier | Usually none | Confirm ramp quota |
| On-target seller | 100,000 | 100,000 | 100% | Tier 1 and Tier 2 | None | Check OTE alignment |
| Stretch month | 100,000 | 118,000 | 118% | Three bands | Not yet if 125% start | Watch Tier 3 rate |
| Accelerated quarter | 300,000 | 405,000 | 135% | All regular tiers | Above 130% | Check cap language |
| Large enterprise win | 600,000 | 960,000 | 160% | Large Tier 3 slice | Meaningful top slice | Validate booking credit |
| Split territory deal | 120,000 | 200,000 at 50% | 83% | Tier 1 and Tier 2 | None after split | Audit shared ownership |
| Renewal save | 80,000 | 92,000 | 115% | Retention tiers | Expansion slice | Confirm renewal base |
| Manager override | 1,000,000 | 1,180,000 | 118% | Team core rate | May start at 120% | Team gate and cap |
📝 Quick Lookup Tables
| Attainment Level | Typical Treatment | Math Check | Payroll Review |
|---|---|---|---|
| Below 50% | Tier 1 only or threshold gate | Credit stays under first cap | Review eligibility floor |
| 50% to 99.9% | Tier 1 plus partial Tier 2 | No accelerator dollars | Check quota prorations |
| 100% to 124.9% | Core plus stretch tier | Only excess above quota hits Tier 3 | Compare to target incentive |
| 125% to 149.9% | Regular accelerator territory | Top slice receives accelerator | Check cap multiple |
| 150%+ | High accelerator or exception review | Large top marginal slice | Confirm deal exceptions |
| Split below quota | Credit can fall into lower tier | Apply split before tiering | Match CRM split records |
| Adjustment | Where It Applies | Example Entry | Effect On Payout |
|---|---|---|---|
| Split credit | Before tier calculation | 50% | Reduces eligible credit and attainment |
| Quality gate | Before tier calculation | 90% | Pays only verified credit |
| Holdback | After gross commission | 10% | Reserves payout for later release |
| Recoverable draw | After holdback | 1,000 | Subtracts prior advance |
| Payout cap | Before holdback and draw | 3x target | Limits exceptional payout |
| Flat rate mode | Instead of marginal bands | 5% | Applies one rate to all eligible credit |
✅ Actionable Checks
Closing a big deal always gives you that rush. But then you start to worry. You pull out sales compensation plan and scan through it until you see those marginal rate details. And then you realize: The estimated amount may or may not hit your bank account.
Most sellers thinks of their commission as a one percent number. It’s never that easy. There’s always something more. Something like tiered deals, which motivate momentum yet also add complexity so much so that a triumph becomes a mistake on your tax return.
How to Calculate Your Sales Pay
Typically, the part that confuses people most are marginal tiers. (This isn’t like a flat rate: it’s not one percent on every single dollar.) With a marginal plan, your money is split across several band. You get an incentive, perhaps 2%, in first band (usually up to half your quota). Next comes main band (the middle part), which pays out at higher rate, such as 5%. And then you have the big guns… The portion above goal that activates higher rates.
On this page, we’ve got the math figured out for you with our calculator. You won’t apply top tier to everything you earn, because you hit 120% attainment? Nope. Only the portion over your target get the kicker.
Other invisible cuts can decrease amount paid out at end. Before your commissions are even calculated, there’s the matter of quality gates and splits. Quality gates limits which portion of a sale qualifies for credit. After that, a percentage split between reps kicks in. The number goes down again based off whatever percentage of the deal that other rep took away from you. For example, if you have a big deal that’s 50/50 with someone else, the deal will appear as half as big once the split is taken into account. That means you’re likely to drop in a lower commission tier after that. Suddenly, although you sell enterprise deals, you gets less money thanks to how the split came out.
Small details matter when it comes to your paycheck. The other twist involves draws and holdbacks. A draw is an advance against future earnings that you have to pay back, while a holdback is a reserve that’s tied to verifying payment. It’s deducted from your gross commission after the fact.
So what’s the order of operations? The answer matters if you want to calculate your effective hourly rate. Tiers go second, but caps, holdbacks and draws goes last. You wouldn’t mess up your calculation if you understand the order in which all of these adjustments occur.
This page provides a safe way to model those scenarios. Adjust the split percentages, the quotas, and add a holdback to view its impact on your net pay. No guessing required. You’ll know exactly which marginal bands have how many dollars and where a cap may cut your income short. You’ll be able to determine whether a stretch goal is worth pursuing, or if capping out might be better.
Incentives are negotiated. Sales compensation is no different; you’re negotiating for the best return, while the company is trying to push behavior they desire. Understanding how pay bands are structured helps you find opportunities. If you can move an additional 5% in sales, then you know you’ve got enough to get a nice chunk into the accelerator band, which essentially doubles your rate on those dollars. Or, alternatively, you discover that a deal with a heavy holdback isn’t as luxurius as it appears.
You just have to figure out how. So, learning your comp plan makes money into money. It moves you from trying to hope for a bonus to planning a payout. You move from guessing about what gets deducted and split and sliced off of your pay to knowing exactly what it is. You become someone who calculates, not someone who guesses. And that’s when the anxiety about the paycheck goes away and the thrill of the close stay.
THAT’S the true value in getting the numbers right.