Three Dice Probability Calculator
Roll three dice and see the exact sum distribution built by integer convolution. Get the probability, ways out of the total outcomes, odds, expected sum, triple chance, and the full 3-to-18 table for 3d6.
🎯Common Roll Presets
📝Dice & Condition Inputs
Default is 3 dice for the classic 3d6 curve.
Primary target. Ignored for the triple condition.
Upper bound used only when condition is between.
🔢Setup Snapshot
📊Sum Distribution (Current Setup)
| Sum | Ways | Probability | Odds (1 in) | Cumulative ≤ | Cumulative ≥ |
|---|---|---|---|---|---|
| Calculate to build the full sum distribution table. | |||||
🗂3d6 Sum Comparison Grid
| Sum | Ways | Probability | Odds (1 in) | Cumulative ≤ | Cumulative ≥ |
|---|---|---|---|---|---|
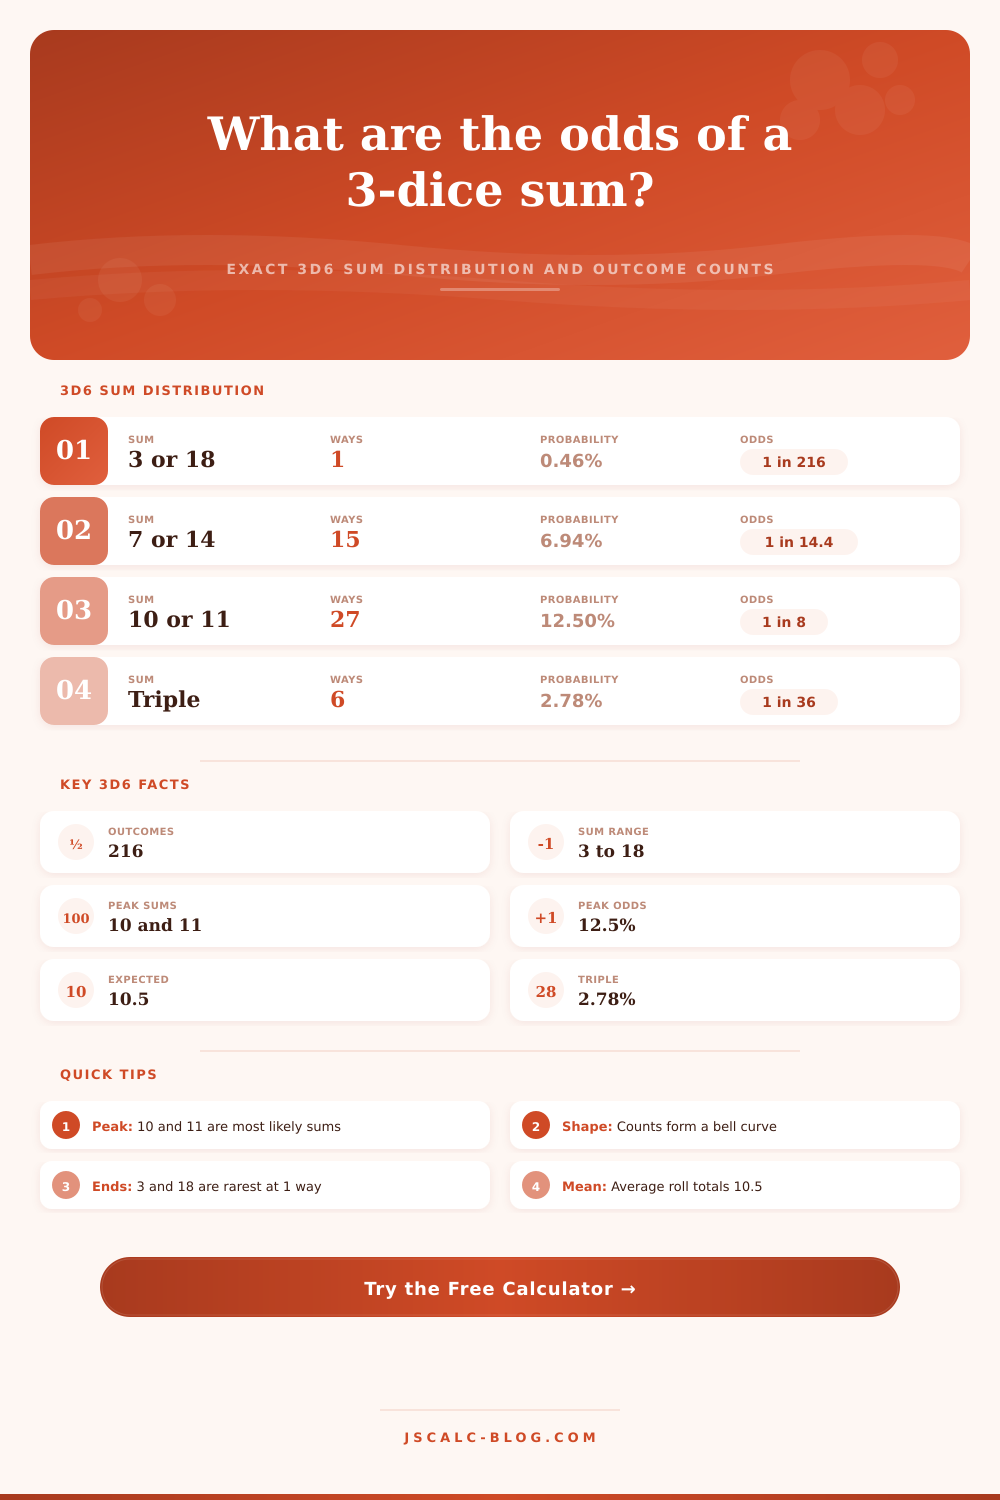
| 3 | 1 | 0.46% | 216 | 0.46% | 100% |
| 4 | 3 | 1.39% | 72 | 1.85% | 99.54% |
| 5 | 6 | 2.78% | 36 | 4.63% | 98.15% |
| 6 | 10 | 4.63% | 21.6 | 9.26% | 95.37% |
| 7 | 15 | 6.94% | 14.4 | 16.20% | 90.74% |
| 8 | 21 | 9.72% | 10.29 | 25.93% | 83.80% |
| 10 | 27 | 12.50% | 8 | 50.00% | 62.50% |
| 11 | 27 | 12.50% | 8 | 62.50% | 50.00% |
| 15 | 10 | 4.63% | 21.6 | 95.37% | 9.26% |
| 18 | 1 | 0.46% | 216 | 100% | 0.46% |
🎲Triples & Special Outcomes (3d6)
| Outcome | Ways | Probability | Odds |
|---|---|---|---|
| Any triple (three alike) | 6 | 2.78% | 1 in 36 |
| Specific triple (e.g. 4-4-4) | 1 | 0.46% | 1 in 216 |
| All three different | 120 | 55.56% | 1 in 1.8 |
| Exactly one pair | 90 | 41.67% | 1 in 2.4 |
| At least one 6 shown | 91 | 42.13% | 1 in 2.37 |
| Straight 1-2-3 order-free | 6 | 2.78% | 1 in 36 |
🛡3d6 Ability Score Odds
| Score | Ways | Chance Exact | Chance ≥ Score | Tier |
|---|---|---|---|---|
| 18 | 1 | 0.46% | 0.46% | Legendary |
| 16 | 6 | 2.78% | 4.63% | Excellent |
| 15 | 10 | 4.63% | 9.26% | Very good |
| 13 | 21 | 9.72% | 25.93% | Above avg |
| 10 | 27 | 12.50% | 62.50% | Average |
| 8 | 21 | 9.72% | 90.74% | Below avg |
| 6 | 10 | 4.63% | 98.15% | Weak |
| 3 | 1 | 0.46% | 100% | Minimum |
⚙How the Convolution Works
📋Quick Reference Values (3d6)
| Question | Ways | Probability | Odds |
|---|---|---|---|
| P(sum = 3) | 1 | 0.46% | 1 in 216 |
| P(sum = 10) | 27 | 12.50% | 1 in 8 |
| P(sum = 18) | 1 | 0.46% | 1 in 216 |
| P(sum ≥ 15) | 20 | 9.26% | 1 in 10.8 |
| P(sum ≤ 8) | 56 | 25.93% | 1 in 3.86 |
| P(any triple) | 6 | 2.78% | 1 in 36 |
💡Reading the Curve
Three six-sided dice are just a number generator, right? That’s how you use them, but what they do is follow a statistical distribution that’s not like flipping a coin at all. Each individual die has an even chance of landing on any result, but the more dice you combine the less uniform your results will be. When you roll multiple dice, sum is a curve in which middling results are far more probable than extreme ones.
This is why you learn about this deviation: to make your games play better, and to create characters smarterer. Luck follow a predictable path of risk and reward. This information becomes important when designing a balanced system. If you want few instances where high numbers are rolled then three dice would makes sense since there’s less than half a percent chance of rolling a 3 or 18. Instead, you move toward the middle of chart and find consistency.
Why Three Dice Are Predictable and Fair
The most common rolls is 10 and 11; both show up roughly 12.5% of the time. That clumping help three dice feel predictable different than the wild swings of one die or two dice. There’s still variance but with a distinct middle ground that holds the game together, and allows play to continue without being broken by extreme rolls.
That’s where the “average” confusion arises for folks. You don’t ever get to 10.5 when you roll dice. Dice yield whole numbers. It is center point of the whole system. Its expected value is 10.5. That’s why it works, there’s symmetry and game masters can assumes that most people end up somewhere within functional range of scores. As you see from the reference tables, probabilities rapidly drop away from middle. It isn’t a slow tapering off but a fairly steep one on both sides of average.
The small differences are there, some are easier to roll than others, and some depend on different rules. Is it hard to roll exactly a certain number? Or is it difficult to roll at least that many? It sounds like a small detail, but consider this: What if you’re trying to hit a minimum for a once-in-a-blue-moon skill? Are you willing to risk coming up short when most other players settle for a solid 14, which puts them in the top quarter of all possible results? Knowing the probabilities helps you calculate how much you should of spend chasing perfection.
If you aim to get as high as 16 or better, you have fewer than one-in-twenty chances of getting what you want. That’s only about 4.6% of the possible outcomes. Triples add a third dimension to the equation. No matter how many numbers you have in a row, the chance of rolling three of any given kind are 2.78%.
That’s rare enough to count as something special. It is something like a critical event. It could be a trigger. The feeling of rolling three of a kind is special because it’s so rare. But because they’re likely to occur during a session, they feel special without dominating the game flow. And here’s why: Matching up three different variables are hard, no formula required.
What is it about this system that’s so powerful? It’s predictable. You’re not battling blind luck; you’re operating inside a defined set of odds. Yes, each individual roll is different, yet the cumulative effect stay consistent due to the way the distribution smooths out the differences. That consistency is why dice games are repeatable and fair.
Whether you’re building a hero or studying game design concepts, three-dice curve is a steady balance for your efforts. It keeps chance relevant without overpowering planning, which means each roll matters. And the numbers show that there is indeed method to the madness of dice games: order do come from chaos.