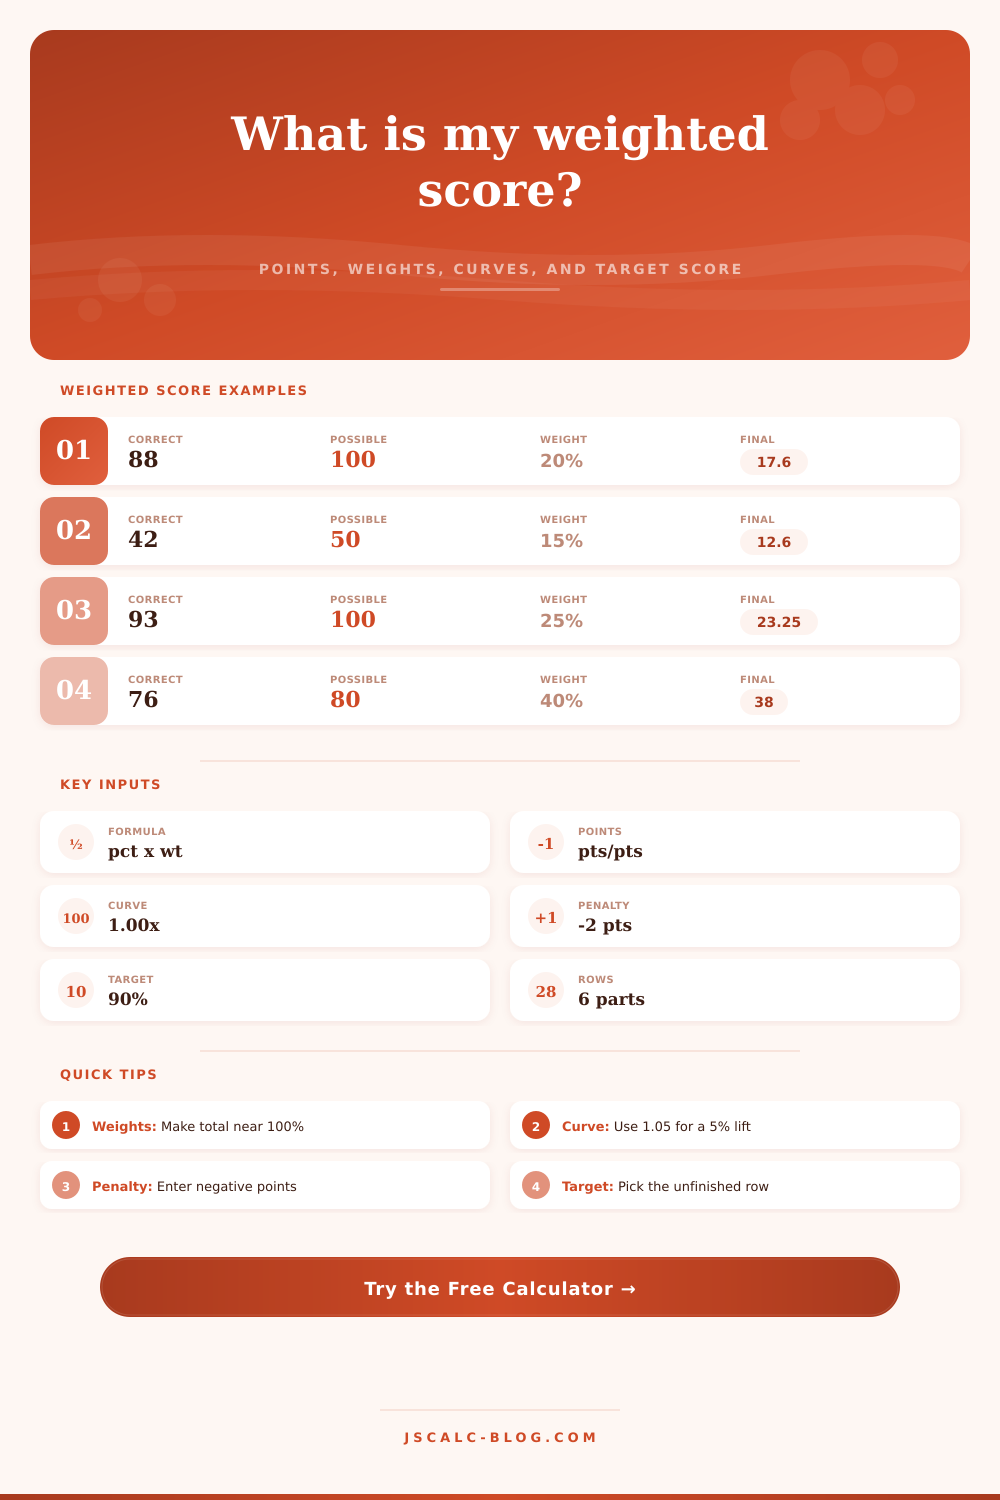
Section Weighted Score Calculator
Combine correct points, possible points, section weights, curve multipliers, penalties, extra credit, and a target score into one weighted final percentage.
Formula: section contribution = section percent x section weight / 100; final score = sum of contributions.
| Section type | Common weight | Points pattern | Typical curve | Contribution example |
|---|---|---|---|---|
| Homework set | 10% to 25% | many small scores | 1.00x | 88% x 20% = 17.6 |
| Quiz average | 10% to 20% | weekly checks | 1.00x to 1.03x | 84% x 15% = 12.6 |
| Lab reports | 15% to 30% | rubric points | 1.00x | 92% x 20% = 18.4 |
| Midterm exam | 15% to 30% | single test | 1.00x to 1.08x | 78% x 25% = 19.5 |
| Final project | 10% to 35% | deliverable rubric | 1.00x | 90% x 15% = 13.5 |
| Participation | 5% to 15% | attendance or posts | 1.00x | 96% x 5% = 4.8 |
| Entry | Meaning | Before | After section % | When to use |
|---|---|---|---|---|
| 1.00x curve | no curve | 86% | 86% | standard grading |
| 1.03x curve | 3% lift | 86% | 88.58% | small class curve |
| 1.10x curve | 10% lift | 76% | 83.6% | hard exam curve |
| +2 adjustment | extra credit | 90% | 92% | bonus rubric points |
| -3 adjustment | penalty | 90% | 87% | late deduction |
| 110 cap | upper limit | 106% | 106% | allow extra credit |
| Known contribution | Remaining weight | Target final | Needed section % | Reading |
|---|---|---|---|---|
| 64.0 pts | 30% | 80% | 53.33% | target is comfortable |
| 68.5 pts | 25% | 90% | 86.00% | strong remaining work |
| 72.0 pts | 20% | 88% | 80.00% | normal exam range |
| 55.0 pts | 35% | 75% | 57.14% | pass target within reach |
| 81.0 pts | 15% | 93% | 80.00% | A target remains live |
| 61.0 pts | 20% | 90% | 145.00% | needs extra credit |
| Step | Input | Formula | Output | Check |
|---|---|---|---|---|
| 1 | correct and possible points | correct / possible x 100 | base section percent | possible must be above 0 |
| 2 | curve multiplier | base percent x curve | curved percent | 1.00 means no curve |
| 3 | penalty or extra credit | curved percent + adjustment | section percent | negative entries subtract |
| 4 | section weight | section percent x weight / 100 | contribution | sum weights near 100 |
| 5 | course adjustment | sum contributions + global adjustment | final score | extra credit can exceed 100 |
| 6 | target and remaining row | (target - known) / remaining weight | needed section score | cap shows feasibility |
You might feel confused by your spreadsheet of syllabi halfway through semester, or maybe even later. You have a midterm grade? Sure. Homework score? Check. What about a final project? Okay. But what about in comparison? What are those scores relative to each other? What’s the math on one that’s worth 10 percent? What about one that’s worth 30 percent?
This is where a weighted score calculator comes into play. With it, you can plug in all those different inputs and make them mean something. The worry of not knowing can translate into tangible numbers: percentages and goals that you can manage.
How a Weighted Score Calculator Helps Your Grades
Students makes the mistake of viewing all work equally. An annoying bad quiz is one thing, but a bad final exam can screw up course grade. Why? It is because of the weighting system. Look at your inputs and you’ll see which battles actualy matter. Input your points, let the calculator do the weighting for you, and forget about doing math, spend your time strategizing.
This shows you that getting ninety percent on a forty percent category isn’t the same as getting ninety percent on a ten percent category. It’s easy math with big stakes. Penalties and curve multipliers is nuances that standard grade books often ignore. Some teachers takes off points for being late, some tack on a flat curve to a difficult exam, etc. Those types of changes will impact your grades right away. For example, one point zero five may not sound like much, but when multiplied against a heavily weighted midterm, it could alter your letter grade.
Before you crunch numbers, do you want to know if that grade jump is legit? With this tool, you’ll be able to run those kinds of scenarios. That way, you can determine whether or not it’s worth it to wait until the final grades are posted.
But the real powerhouse is the target planner. This section allow you to manage your grades rather than merely respond to them. Simply input the final grade you’d like to recieve, and it calculates backwards to display the mark required on future assignments. It tells you if you need an eighty percent on the final exam to save an A, or if you are already mathematically locked into a B.
This shifts your perspective from “oh crap” to “I know what I’m doing.” You cease fretting over stray points here and there, you begin focusing on high-value opportunities. What’s the difference? The difference is having a game plan versus not having one at all.
Does your total weight add up? Your final may be 50% and your homework may be 20%, but the rest does not adds up to 30%. There’s an extra ten percent somewhere that can be dangerous. Often, this missing ten percent comes from attendance or participation, which is hard to measure. Use the calculator to see if your weights all add up to one hundred percent. That way you know you’re basing your grade on complete information. Otherwise, your calculated grade could be different than your official grade.
This is a good test for any vague parts of the syllabus. That’s when you realize your grade might be stronger/weaker then anticipated. Which sections help it and which sections hurt it? That’s what the breakdown reveals. Maybe you are killing it on participation but struggling with midterms. Knowing this, you can focus your studying in areas where it will benefit you most.
Weighted averages aren’t just for math majors; they is for anyone who wants to see how everything breaks down. See the reference table on the page for how each section break down to the total.
Clarity
A lot of stress at college stems from not knowing what’s going on, beyond how much work needs doing. Convert the weights and points into an end-of-semester % and a future score that you need. Then you know exactly what to do to get where you want to be. It is not magical but it is better than nothing. Plug in the data. See what to do. Do it. When the gameplan shows up, the panic subsides.