Sales Quota Attainment Calculator
Measure quota attainment, gap to quota, required run-rate, period elapsed, forecasted attainment, and accelerator threshold progress.
Use bookings, ARR, meetings, units, or another consistent quota measure.
Subtracts risk from pipeline and commit before forecasted attainment.
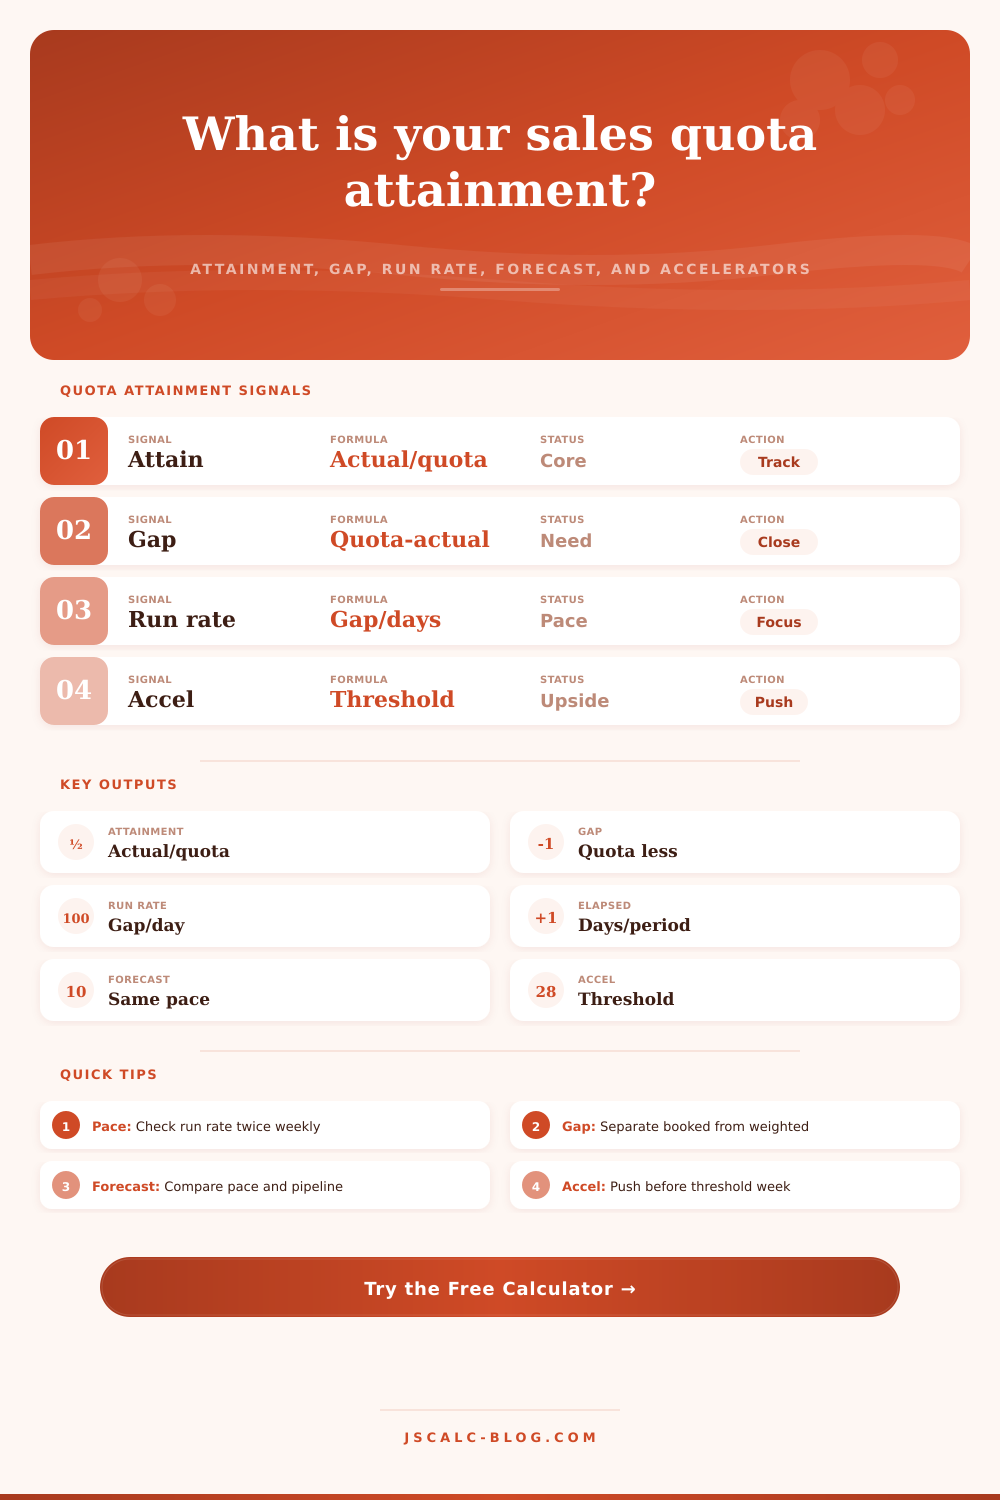
Attainment % = actual sales / quota x 100. This is the core measurement requested for quota performance.
Gap to quota = quota - actual sales. A negative gap means the rep or team is already above quota.
Required run-rate = remaining gap / remaining days. Use this to translate a quota shortfall into daily execution pace.
Forecasted attainment = forecasted total / quota x 100. This calculator compares same-pace forecast with booked plus risk-adjusted pipeline and commit.
Accelerator gap = quota x accelerator threshold % - forecasted total. A value at or below zero indicates expected accelerator eligibility.
| Attainment Band | Sales Signal | Gap Action | Forecast Check |
|---|---|---|---|
| Below 50% | Materially behind target | Prioritize largest near-term closes | Inspect stage aging and slipped dates |
| 50% to 74% | Behind but recoverable | Build daily close plan from gap | Require strong commit evidence |
| 75% to 89% | Close to normal pace | Protect committed deals | Compare run-rate with last period |
| 90% to 99% | Final stretch | Sequence closes by signature date | Separate booked from verbal commit |
| 100% to 119% | Quota achieved | Move effort toward upside | Watch accelerator trigger point |
| 120% plus | Over quota | Maximize accelerators and pull-ins | Check capacity and delivery risk |
| Sales Motion | Typical Period | Healthy Pipeline | Forecast Bias | Run-Rate Focus | Accelerator Watch |
|---|---|---|---|---|---|
| SMB transactional | Month | 2x to 3x quota | Volume variance | Daily activity and fast closes | Week three pace |
| Mid-market AE | Quarter | 3x to 4x quota | Stage accuracy | Weekly commit hygiene | Final month commit |
| Enterprise field | Quarter | 4x to 5x quota | Deal slippage | Mutual close plans | Legal and procurement |
| Strategic seller | Year | 5x plus quota | Low deal count | Milestone conversion | Expansion timing |
| Expansion team | Quarter | 2x to 3x quota | Customer timing | Usage and adoption signals | Renewal co-term dates |
| Renewal desk | Month | 1x to 1.5x quota | Churn risk | Save plan completion | Retention floor first |
| SDR quota | Month | 1.5x to 2.5x goal | No-show rate | Accepted meetings per day | Quality threshold |
| Channel sales | Quarter | 3x to 5x quota | Partner opacity | Partner commit validation | Distributor booking date |
| Period Elapsed | On-Pace Attainment | Risk Signal | Management Check |
|---|---|---|---|
| 10% | 10% of quota | Too early for heavy judgment | Confirm pipeline creation |
| 25% | 25% of quota | Early gap forming | Review next-step quality |
| 50% | 50% of quota | Midpoint miss risk | Lock commit and recovery plan |
| 75% | 75% of quota | Closing-window pressure | Remove deal blockers fast |
| 90% | 90% of quota | Limited recovery time | Escalate signature blockers |
| 100% | 100% of quota | Period complete | Compare forecast to actual |
| Threshold | Meaning | Use Case | Planning Move |
|---|---|---|---|
| 90% | Early bonus trigger | Ramp or retention role | Track threshold before full quota |
| 100% | Standard quota trigger | Most direct sales roles | Close gap before upside work |
| 110% | Stretch trigger | Strong territory or team quota | Protect high-confidence pull-ins |
| 120% | Aggressive trigger | High leverage commission plan | Separate realistic upside from hope |
| 150% | Elite overachievement | Strategic or uncapped plan | Audit delivery and renewal risk |
Time moves on, regardless of the slip in deals. This applies whether you’re awaiting legal review or you’ve put pen to paper.
Attaining sales quota isn’t simply a division issue. It’s sign of execution discipline.
How to Hit Your Sales Goals
At the end of each quarter, most team will check their % against the goal and be satisfied with being on track. That’s how they miss it. Once you enter pipeline and actuals, the math are calculated for you. This frees you up to focus on what behaviors drives the needle.
Many people view attainment as a static snapshot. In reality it’s a speed limit. How far along are you? And how quickly do you need to go the rest of the way? That’s why the raw % doesn’t matter more than the gap analysis.
Are you at 50% of the month, but only got 20% of your quota booked? That’s not good. The math’s harsh. You need to produce five times the average daily rate from here on out.
You can’t coast, the tool spells that all out. It tells you what required run rate is each day. So it translates that vague feeling of being behind into a clear daily target. It lets reps plan their weeks with intent instead of anxiety.
Discipline are required for the inputs. What’s really booked? What do you expect to close?
A lot of salespeople stack up their pipeline with everything. They don’t care if it’s stage one, two or three, they believe it’s going to happen so they add it to pipe. The calculator requests a weighted pipe and a safety buffer. It forces you to look at the prediction and see what’s real.
It also reinforces that until the money hits the bank it isn’t revenue. Add in a risk adjustment. That helps protect you from guessing too high. To management, that is typically far worse than under-forecasting. It establishes credibility.
Think of the Accelerator Threshold. That’s when your comp plan kicks up a notch. Have you crossed that threshold? Then the game changes.
If you’re already past the accelerator threshold, your plan is to protect your upside and shift from closing new business. Don’t get distracted chasing one more big deal. Close those small but safe deals. Those will keep you on right side of the line.
That’s why I created the reference table on the page. It tells you what makes sense, and what band you’re in.
When you’re in the final stretch, sequence your closes based off when they’ll be signed. If you’re far behind, focus first on biggest near-term closes.
Your mental model changes depending on which sales motion you are using. For example, an SDR role is about high volume with consistent results toward their meeting quota. An enterprise seller manages a lot of risk and long cycle.
How much pipeline should they be carrying? You should adjust your pipeline coverage based off this. SMB reps may have 2x quota in pipeline. Enterprise teams needs five times or more to account for slippage. The calculator lets you choose your sales motion. This will change the context around your results. It’s not just about how many. It’s about what deals support it.
But here’s the thing: time is non-renewable. Each day that passes makes this worse. What you could of easily catch up on at the start of the month becomes a can’t-catch-up-at-all problem by the end.
Twice weekly check-ins are needed. They stop minor oversights from turning into permanent holes. It’s more than selling goods; it’s about managing probability and time. That’s what the tool allows you to visualize.
Feedback loop: Quotas are a form of feedback. Measure. Adjust. Repeat.
Hitting the number is less important than understanding what made it happen. Was it a big deal? A steady pipeline? The calculator helps you get the data. You supply the insight. Apply it to filter out the noise from the signal. Concentrate on the activities that accelerate your run rate.
By the end of the period, you won’t be shocked by the final score. You’ll know the distance, the speed and the remaining time. Knowing that is the difference between hoping for victory and engineering it.