Safety Stock Calculator
Compare the basic max-minus-average method with statistical safety stock, reorder point, review-period coverage, and service-level risk.
📌 Presets
🧮 Inventory Inputs
The comparison grid always shows every method.
Average units sold or consumed per day.
Use a realistic high day, not a one-time error.
Daily demand SD in units per day.
Supplier lead time SD in days.
Use 0 for continuous review; add days for weekly or monthly ordering.
Safety Stock Results
📊 Current Comparison Grid
🧱 Planning Snapshot
📘 Service Level Z Table
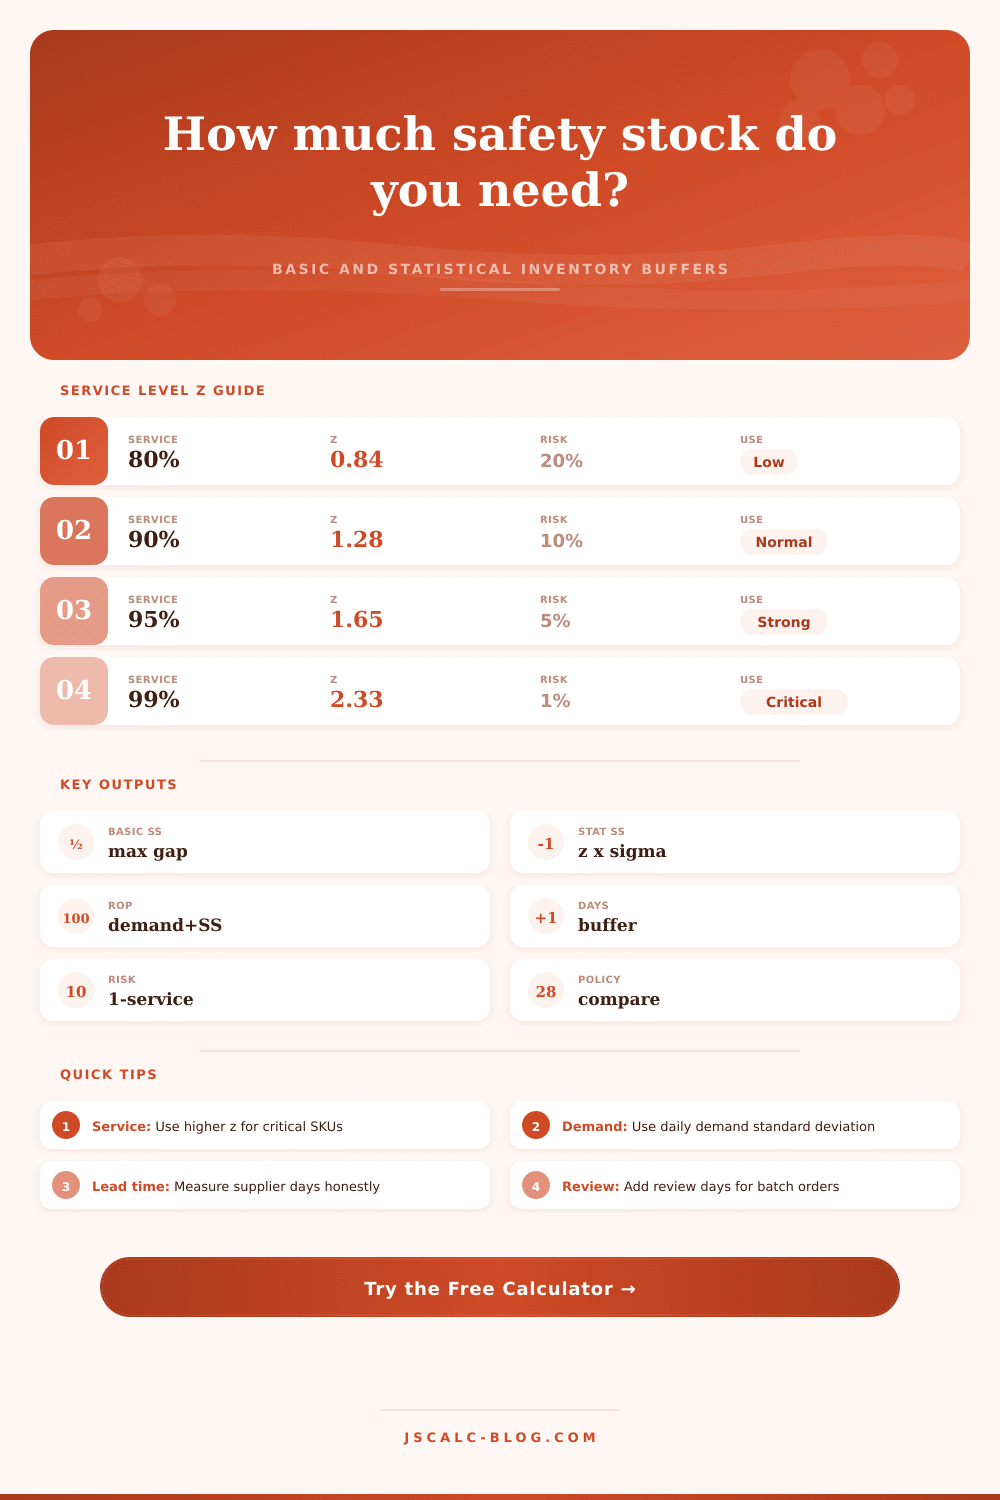
| Cycle Service Level | Z Score | Expected Stockout Risk | Common Inventory Use |
|---|---|---|---|
| 80 percent | 0.84 | 20 percent | Low-value items with easy substitution |
| 85 percent | 1.04 | 15 percent | Stable items where stockouts are tolerable |
| 90 percent | 1.28 | 10 percent | Routine finished goods and replenishment SKUs |
| 92 percent | 1.41 | 8 percent | Moderate priority items with customer impact |
| 95 percent | 1.65 | 5 percent | Important SKUs with meaningful stockout pain |
| 97 percent | 1.88 | 3 percent | High-service channels or constrained suppliers |
| 98 percent | 2.05 | 2 percent | Critical parts with slower recovery |
| 99 percent | 2.33 | 1 percent | Essential inventory with severe outage impact |
⚖ Method Comparison Table
| Method | Formula | Best Fit | Watchout |
|---|---|---|---|
| Basic safety stock | Max use x max lead - average use x average lead | Quick planning with reliable max values | Can overstate rare spikes |
| Statistical safety stock | z x sqrt(LT x demand SD² + demand² x LT SD²) | Measured demand and supplier variability | Needs clean history |
| Higher of both | max(basic, statistical) | Conservative replenishment policy | More stock held |
| Blended buffer | (basic + statistical) / 2 | Transitioning from rules to statistics | May hide true risk |
| Review-period add-on | average demand x review days | Weekly or monthly ordering calendars | Not needed for continuous review |
🔍 Variability Signals
| Signal | Demand CV | Lead Time CV | Planning Meaning |
|---|---|---|---|
| Low | Under 15 percent | Under 10 percent | Statistical buffer usually stays modest |
| Medium | 15 to 35 percent | 10 to 25 percent | Service level choice materially changes stock |
| High | 35 to 60 percent | 25 to 45 percent | Separate demand spikes from supplier delays |
| Extreme | Above 60 percent | Above 45 percent | Review forecast, supplier promises, and SKU policy |
📋 Preset Reference Table
| Scenario | Demand Pattern | Lead Time Pattern | Typical Policy |
|---|---|---|---|
| Steady Retail SKU | Repeatable daily sales | Stable domestic supplier | 90 to 95 percent service |
| Promo Spike Item | High campaign peaks | Normal inbound schedule | Use max method as a stress test |
| Supplier Delay Risk | Moderate demand swings | Long tail delivery delays | Lean on lead time SD |
| Critical Spare Part | Low daily usage | Slow recovery when out | 98 to 99 percent service |
| Weekly Review Policy | Ordinary daily demand | Purchasing runs weekly | Add review-period demand |
💡 Safety Stock Tips
Safety stock is a buffer. It’s a buffer between you and a disappointed buyer. You don’t have to panic if your shelf are empty because you’ve got a buffer.
However, most people thinks of this buffer as a fuzzy number. To them, it’s “twice my typical order size“, which ties up working capital and burns cash.
How to Calculate Safety Stock
The key here is telling chaos (when reality isn’t playing out according to plan) apart from more predictable type of demand. You could run the math yourself with the calculator above. It removes the guessing game by comparing two approach to calculating risk.
The basic method considers your average versus absolute maximum usage. The statistical method consider your actual standard deviation, which is how much your demand and lead times wiggle around their respective means. Most teams stumble at this second step. They may have great data regarding what’s being sold but lousy data regarding when supplier deliver. This is where changes in lead time sneak in and quietly kill inventory efficiency.
For example, perhaps your supplier normaly takes ten days to ship an order, but every once in awhile they gets caught in a traffic jam or something happens and suddenly take eighteen days to ship; without telling you. In that case, your standard deviation get shot through the roof and forces you to hold far more stock in order to provide same service level.
Math isn’t everything here, economics is also important. Ninety-nine percent? Sounds good, until you realize it demands such a disproportionate quantity of excess inventory to achieve vs. Something like a ninety-five percent target. And that’s laid out in the reference table on the page. What it will do is show you how quickly the Z score increase as you pursue perfection.
If the thing you’re trying to achieve is a cheap commodity item, carrying sufficient stock to hit a ninety-nine percent fill rate probably means wasting money. And if it’s some critical machine part that puts a whole production line at a halt, it is absolutely necessary. Classify your SKU first; then compute.
Your inputs are more important than the formula itself. A lot of planners input their historical averages, which include some outliers: Maybe they have one supplier shut down or had a promotional spike. That’s going to blow up your standard deviation and make it appear like your normal operations is chaotic. Clean your data first. Take out the noise. Let the calculator find real rhythm of your supply chain.
Also, be sure to factor in your review period. If you place your order just once per week, then you’ll want some additional buffer to accommodate those five days between review periods. Batch orders needs this extra buffer, but continuous review systems do not. This gap is often overlooked, leading to lots of little stockout.
Safety stock should never be treated as a constant figure. It’s a dynamic metric that changes in response to changing demand patterns and shifts in supplier performance.
If you notice an outcome, ask yourself: what is it safeguarding me from? It protects you from your customers’ whims. Is it from the slowness of your supplier? What type of variability are we facing here? Once you understand the cause, you can address the issue itself, instead of just masking it with additional inventory. In some cases, increasing reorder points isn’t the solution; perhaps it’s time for a different conversation with your supplier.
You’re not trying to prevent risk because risk cannot be eliminated; instead, you are trying to control it by using effective smart controls. Make sure your safety stocks is thin enough to protect cash flow, yet wide enough to fill the shelves. It is a fine line. You can easily maintain it if you have the correct data.
Use your most-volatile SKU as a starting place and adjust accordingly. Guesswork wouldn’t of saved you, measurement will. Avoid the empty shelf.