Economic Order Quantity Calculator
Find the EOQ order size, ordering cost, holding cost, reorder point, order cycle, and total relevant inventory cost from annual demand, setup cost, holding cost, lead time, and safety stock.
🎯EOQ Presets
📝Inventory Inputs
Use expected annual unit usage, not sales dollars.
Include purchasing, setup, receiving, and inspection time.
The formula needs annual holding cost per unit, H.
Used directly unless the rate method is selected.
Only affects EOQ when holding cost method uses carrying rate.
Typical range often includes capital, storage, shrink, and handling.
Use 365 for calendar demand or workdays for replenishment schedules.
Reorder point uses average daily demand x lead time.
Add buffer stock for demand or supplier uncertainty.
Used to compare current policy against EOQ.
The suggested quantity will respect this floor.
Set to 1 when the item can be ordered by single units.
📊Operating Snapshot
🧮Order Quantity Sensitivity Table
| Quantity | Orders/year | Ordering cost | Holding cost | Relevant cost | Signal |
|---|
🗂Preset Comparison Grid
| Scenario | Demand | Order cost | Holding cost | EOQ | ROP |
|---|
📍Reorder Point Reference Table
| Lead time | Lead demand | Safety stock | Reorder point | Use when |
|---|
📘EOQ Formula And Holding Cost Guide
| Measure | Formula | What it means | Check |
|---|---|---|---|
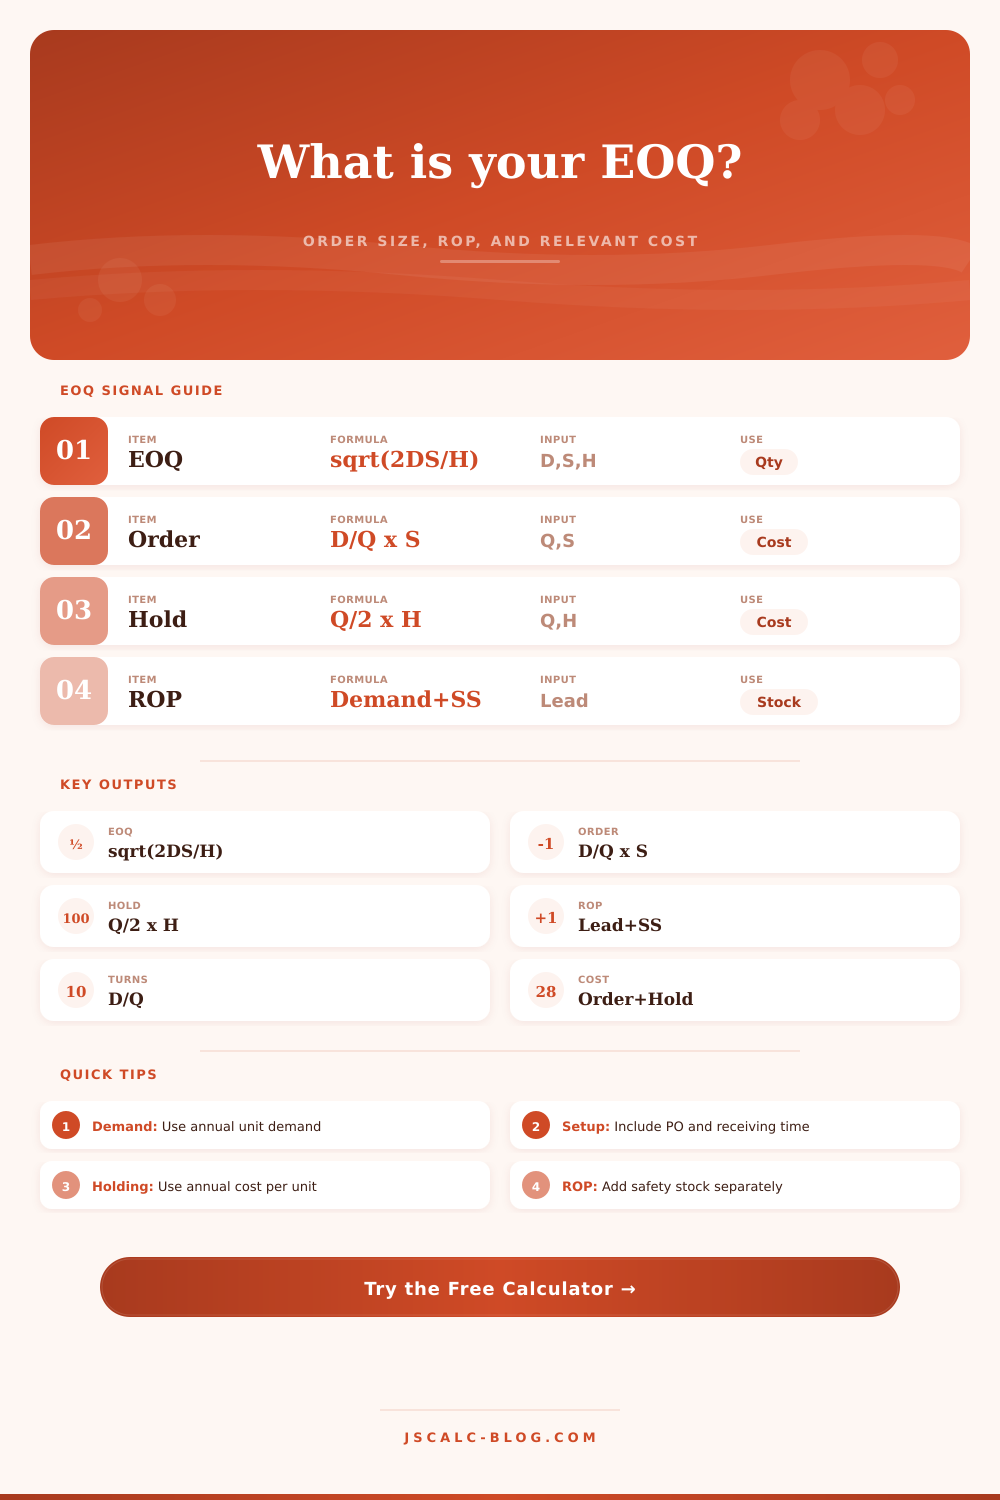
| EOQ | sqrt((2 × D × S) / H) | Order size where ordering and holding costs balance. | Uses annual demand and annual holding cost per unit. |
| Annual ordering cost | (D / Q) × S | Number of annual orders multiplied by cost per order. | Falls as order quantity rises. |
| Annual holding cost | (Q / 2) × H | Average cycle stock multiplied by annual holding cost per unit. | Rises as order quantity rises. |
| Total relevant cost | Ordering cost + holding cost | The EOQ-relevant annual cost before purchase price. | Lowest near EOQ, but lot rules may shift the final order. |
| Reorder point | Daily demand × lead time + safety stock | Inventory position that should trigger the next order. | Use inventory position, not just shelf count. |
| Holding by rate | Unit cost × carrying rate | Converts carrying percentage into H for the EOQ formula. | Keep the rate annual, not monthly. |
💡EOQ Tips
JSCalc-Blog.com: This economic order quantity calculator uses EOQ = sqrt((2 x annual demand x order cost) / annual holding cost per unit), annual ordering cost = (D / Q) x S, annual holding cost = (Q / 2) x H, reorder point = daily demand x lead time + safety stock, and total relevant cost = ordering cost + holding cost.
This is where the economic order quantity formula come into play. Instead of guessing, you plug in a few numbers and equation tells you how many units are enough (without buying to much or running out). It will also help you get your ordering rhythm on track, avoiding emergency situation.
This boils down to a basic concept: holding costs vs. Ordering costs. When you order in bulk, you incurs higher insurance + warehouse storage costs. When you order little-by-little, you incur higher admin + shipping costs. The calculator determine your best order size… The order where sum of all relevant costs is minimized.
How to Order the Right Amount of Stock
A huge number of people neglect the “hidden” cost of keeping inventory around, instead fixating solely on unit price from their suppliers. Rent isn’t the only holding cost. There are also costs for labor, insurance premiums, potential damage, and capital tied up in that inventory.
You can either enter this directly as an annual dollar figure, or as a percent of item value. The latter is naturaly more precise. It scales based off the value of the item. A two-dollar screw is cheaper to hold than a twenty-dollar widget. Underestimating your holding cost lead to the formula recommending you order more, which sucks your cash flow.
How much, and when. Not only do you want to know the former (the latter is the reorder point), but also when you should of order. Reorder point = Average Daily Demand x Supplier Lead Time.
Safety stock is a buffer against both spikes in demand and delays in supply. It causes stockouts, but increases your average inventory level. As graph shows, the reorder point shifts based on lead time, separating the decision about when to buy from decision of how much to buy.
The math has practical limitations. You can enter case pack size into the calculator. You can also enter the minimum quantity you must purchase. Often your supplier want it shipped by the case or even by the pallet. The system may round up to fit those constraints.
That’s where sensitivity table comes in, how much more expensive does it get if you do break the case pack? How much more does it cost because of that rounding? You can choose based off this: if the penalty for not ordering in full cases isn’t steep, then you should go with the EOQ. However, if the penalty is steep, then alter the number of units ordered.
The art (and science) is managing inventory. It’s about keeping it on the move, not in storage. Knowing your costs and demand removes guesswork by using realistic numbers. Stability, not perfection, are the objective.
Keeping the warehouse in order means ordering the correct quantity at the right time. This is true worth of the calculation.