Root Mean Squared Error Calculator
Compute RMSE from actual and predicted values, compare sample RMSE using n - p, and normalize the error by range, mean, standard deviation, IQR, or a custom scale.
📌Presets
🧮Inputs
Enter one row per case. Use commas, tabs, spaces, or semicolons between columns.
Used only for sample RMSE; include intercept if your convention counts it.
Required only when the normalization basis is custom.
RMSE is reported in the same units as the target variable.
Optional target used for the status and comparison grid.
🧭Comparison Grid
📋Row Error Table
| Row | Actual | Predicted | Error e = predicted - actual | Squared Error | Absolute Error |
|---|---|---|---|---|---|
| Calculate to show row-level errors. | |||||
📐Method Comparison Table
| Method | Formula | Denominator | Best for | Current value |
|---|---|---|---|---|
| Calculate to compare standard, sample, and normalized results. | ||||
📊Normalization Reference
| Basis | Calculation | What it answers | Watch for |
|---|---|---|---|
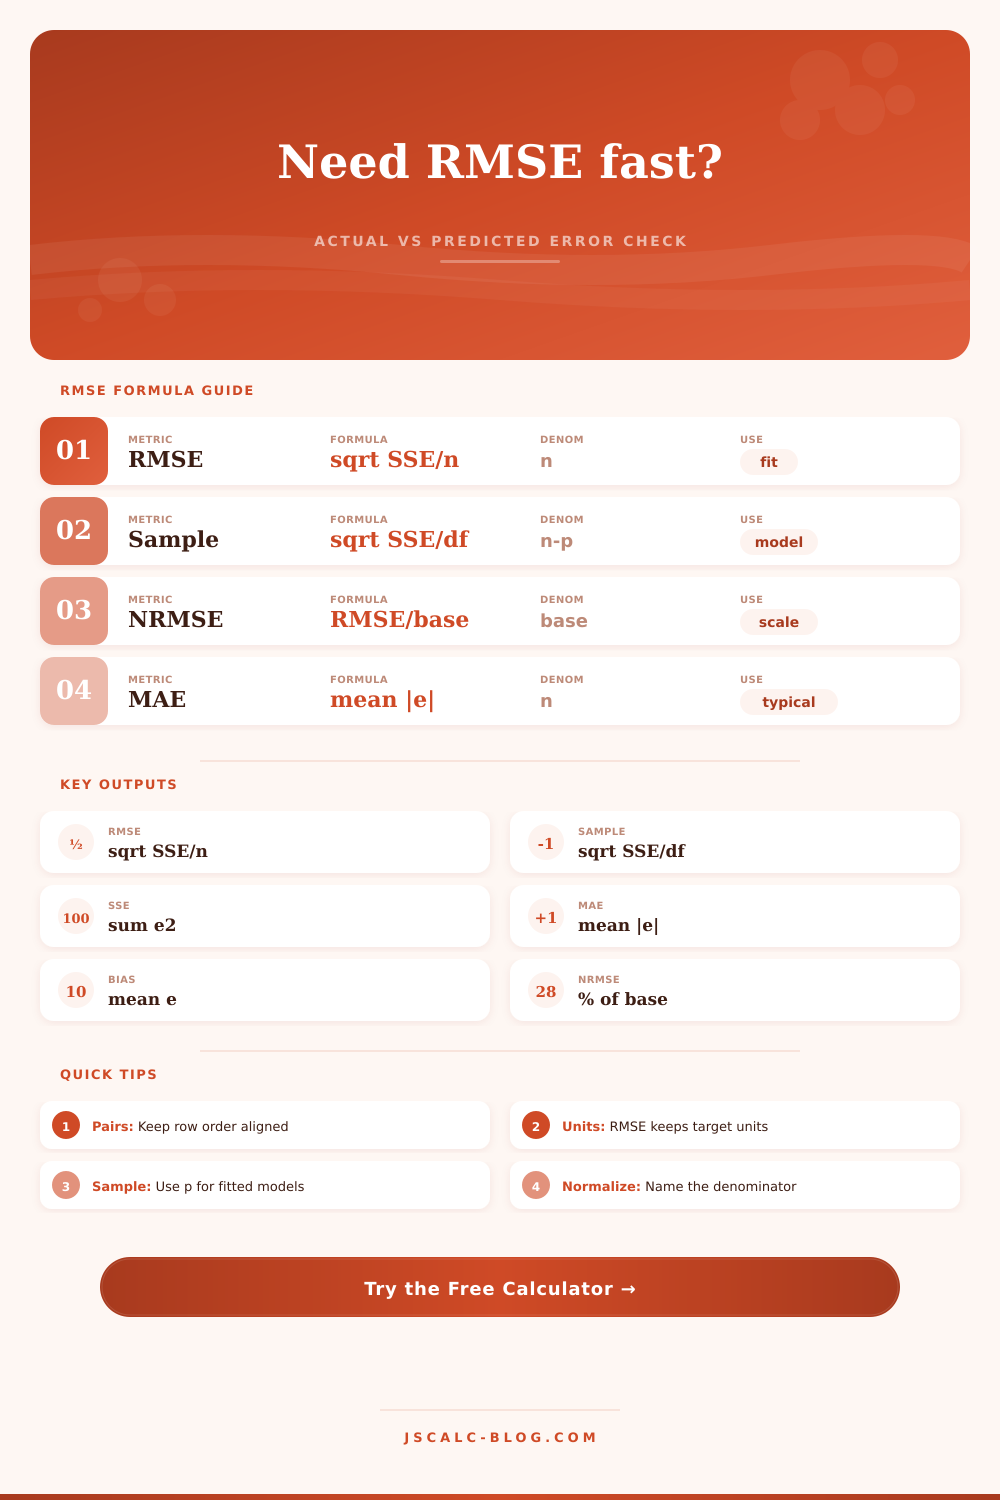
| Range NRMSE | RMSE / (max actual - min actual) | Error as percent of the observed span | Sensitive to one extreme actual value |
| Mean NRMSE | RMSE / mean actual | Error relative to typical level | Unstable when the mean is near zero |
| SD NRMSE | RMSE / sample standard deviation | Error in units of actual variability | Needs at least two actual values |
| IQR NRMSE | RMSE / (Q3 - Q1) | Error relative to the middle 50% | Can be zero with tied or coarse data |
| Custom NRMSE | RMSE / chosen denominator | Error against a business or physical scale | Always report the denominator used |
🔢Formula Breakdown
| Quantity | Symbol | Formula | Meaning |
|---|---|---|---|
| Residual or error | e | predicted - actual | Signed miss for one row |
| Sum of squared errors | SSE | sum e2 | Total squared error before averaging |
| Mean squared error | MSE | SSE / n | Average squared miss for standard RMSE |
| Standard RMSE | RMSE | sqrt(SSE / n) | Error in the target variable units |
| Sample RMSE | s | sqrt(SSE / (n - p)) | Residual standard error style correction |
💡Tips
It’s hard to predict future, and so you measure how wrong you were when you got it wrong. Maybe you predicted the weather, or traffic flow, or housing prices. Or maybe you guessed at load on your servers. How do you know whether your prediction was mere noise, or whether it was useful? That’s what root mean squared error (RMSE) measures.
And it isn’t some random number on a dashboard. It’s the cost of your largest errors. RMSE is not just any old average, it’s an average that squares things, and that’s what matters. If you miss a prediction by one unit, the error is one. A ten-unit miss is a one-hundred-unit miss. It’s heavily penalized for big misses. And that’s key: a few small misses on ten predictions isn’t as bad as missing horribly on one.
What Is Root Mean Squared Error
The math squares your miss before averaging, penalizing large misses and letting you know when things is so-so or just plain right/wrong. It does the math for you, but understanding how it does it, in particular, how it squares the miss before averaging, help transform a raw number into strategic insight.
You can see several iterations of this error metric from the tool. Regular old RMSE take the sum of squared errors and divides by the number of observations. Sample RMSE accounts for the number of parameters your model use. That little tweak in the denominator helps keep you honest, especially if you’re working with a complicated regression model. The model won’t appear to be perfect against training data because it’s simply memorizing noise rather than learning anything about underlying patterns.
There’s also the issue of normalization. A five dollar error on a five thousand dollar car isn’t the same as a five dollar error on a five dollar item. Normalize the result to allow comparison between items at different price points. Divide your actual data by standard deviation, the range, or the mean. Each will provide a different interpretation, as shown in the reference table. The range provides a percent of the total span, whereas the standard deviation indicate how much error is occurring in relation to natural variation. Pick the wrong normalizer and what seems like a terribel model suddenly looks okay. Make sure denominator reflects your business context.
And don’t overlook the bias! The RMSE will tell you how big the error is but not which way. You might always underpredict by five or overpredict by five; the RMSE won’t reflect this. Hence, you want to look at the bias (or the mean signed error). This captures systematic drift. If you have a high bias, that’s not just noisiness. That’s your model being wrong in a particular way. You can often fix this by adjusting your inputs or shifting your intercept.
As you’re going through the row-level error table, keep an eye out for trends. Is there any value where it’s more likely to miss the mark? Low vs. Is it high? That’s what I mean when I say this kind of qualitative review matter equally as much as the aggregated score. You might have a good RMSE but totally suck in those times when it counts most for your users.
Don’t get hung up on the number. Get hung up on the fact that it works reliably and predictably even when pushed to its limits. RMSE isn’t used to judge anything. It’s a calibration tool. If your data is naturaly volatile, having a high RMSE doesn’t mean you did something wrong. If you got a low RMSE but overfitted, then you didn’t do something right. How you interpret that number depends on the nature of your problem.
In both cases… Tuning an algorithm or balancing your budget… You define what an “error” means to you, measure it rigorously, and tweak accordingly. The math is simple. Wisdom is knowing what the numbers realy say about your predictions. That’s what takes you from guessing to knowing.