Mean Squared Error Calculator
Compare observed y values with predicted yhat values and calculate MSE, RMSE, MAE, bias, error totals, and row-level squared-error contributions.
🎯Deep Error Presets
🧮Observed and Predicted Values
Use one pair per line. The calculator reads the first two numbers after an optional label, then uses e = y - yhat.
Shown in the result breakdown and current-fit grid.
RMSE, MAE, and bias use this original y unit.
Optional target for comparing the calculated RMSE.
The row table highlights unusually large absolute errors.
📋Current Error Profile
📈Row-Level Error Table
| Case | Observed y | Predicted yhat | Error e | |e| | e² | MSE share | Flag |
|---|---|---|---|---|---|---|---|
| Run the calculator to fill row errors. | |||||||
🗂Metric Summary Table
| Metric | Value | Formula | Interpretation |
|---|---|---|---|
| Run the calculator to fill summary metrics. | |||
📐Formula Breakdown
📚Error Metric Comparison
| Metric | Formula | Reported unit | Strength | Watch for |
|---|---|---|---|---|
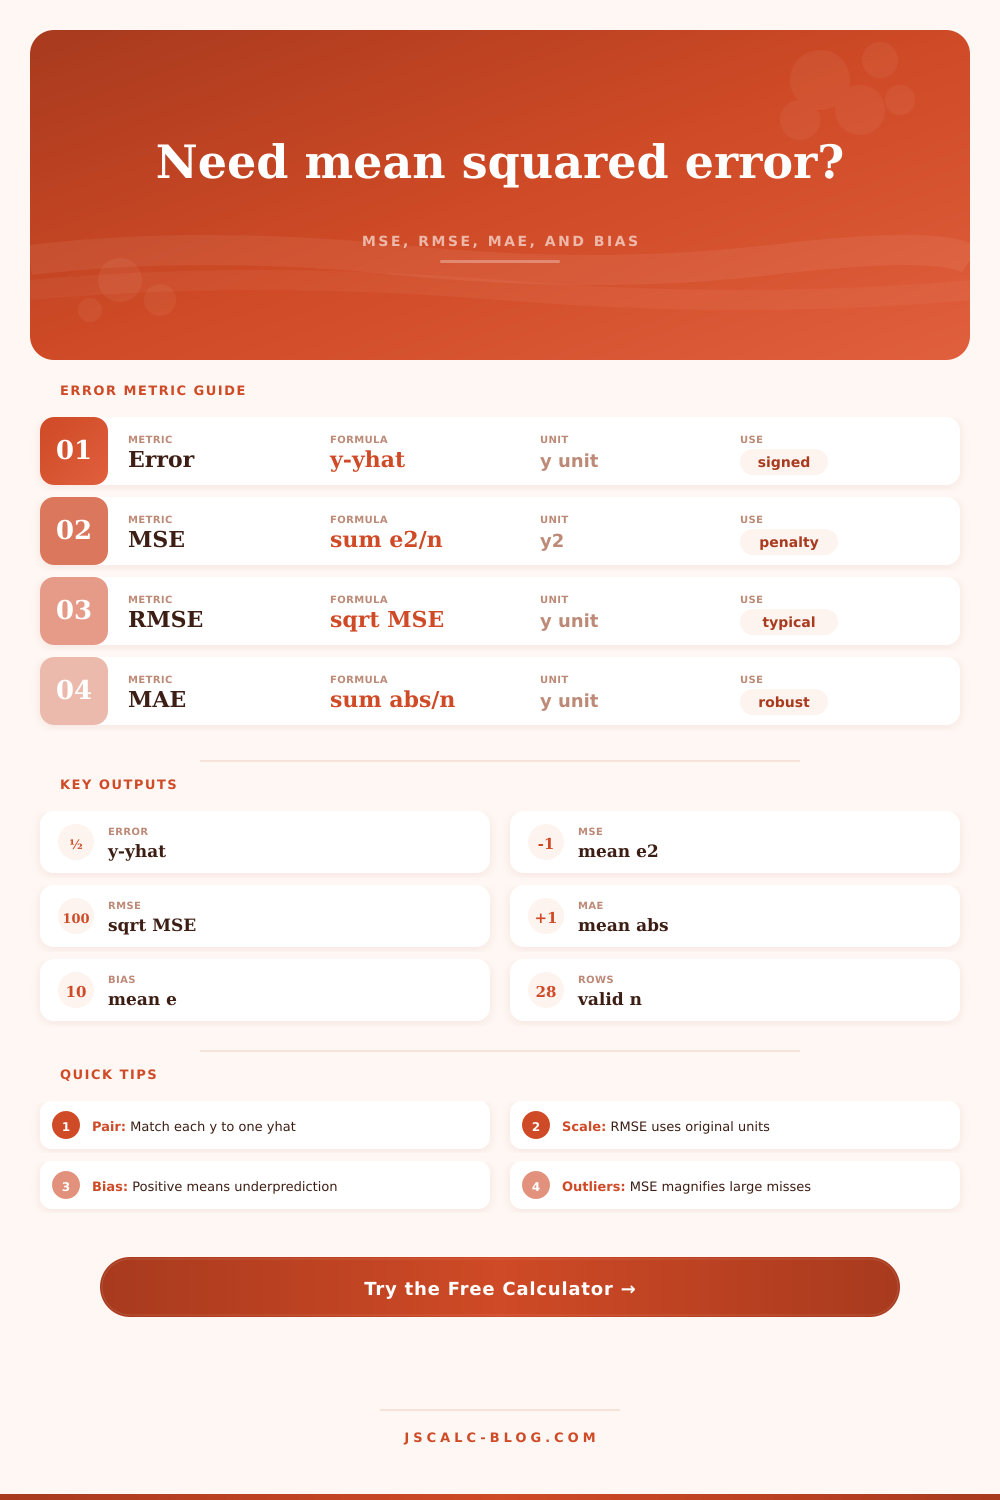
| MSE | sum e2 / n | Squared y units | Strongly penalizes large misses | Harder to interpret directly |
| RMSE | sqrt(MSE) | Original y units | Readable average-error scale | Sensitive to outliers |
| MAE | sum |e| / n | Original y units | Stable typical absolute miss | Does not emphasize big misses |
| Bias | sum e / n | Original y units | Shows direction of error | Positive and negative errors cancel |
| SSE | sum e2 | Squared y units | Useful for model comparisons | Grows with sample size |
| Max |e| | largest absolute error | Original y units | Finds worst miss quickly | One row can dominate attention |
🔍Model Review Guide
| Check | What to compare | Good sign | Possible issue |
|---|---|---|---|
| Pair count | Valid rows n | Matches the evaluation set | Missing actuals or predictions |
| RMSE target | Calculated RMSE vs target | At or below the benchmark | Model misses useful tolerance |
| Bias direction | Mean signed error | Close to zero | Systematic over or underprediction |
| Large errors | |e| above selected screen | Few highlighted rows | Outliers or segment weakness |
| Top share | Largest e2 divided by SSE | No single row dominates | One case drives the MSE |
| MAE vs RMSE | RMSE divided by MAE | Moderate ratio | Large-error tail may be present |
💡Practical Tips
Until one day there is a cold snap. Your average error rise. This happens because of the mean squared error. To compute mean squared error, you take the difference between what you predicted and what actualy happened. Then you square it and average it. The squaring change the weighting of errors. Big errors gets big fast, while small ones don’t change things much.
And the calculator does this math for you; you never see it happen in front of your eyes. Instead you see pattern of your mistakes. But these numbers say something else. MSE penalizes big differences. A difference of 10 degrees between predicted value and actual value earns an error value of 100. A difference of 2 degrees result in an error value of just four. That’s great when you don’t want to make a huge mistake. But one big error can drag down your score more different than five small errors. It hurts when there is lots of little random outliers in your data. The reference table show what the metrics do to the data.
How to Understand Prediction Errors
To convert it back into our original units, we use root mean squared error. That’s just name for taking the square root. Now we can easily interpret it. An RMSE of five thousand dollars means that on average, our predictions is off by five grand.
The mean absolute error is milder. It simply averages the absolute differences. No more squaring allowed. That gives us typical size of error, without allowing a single extreme example to dominate everything. In practice, you’ll see both of these used together. If the RMSE is way bigger than the MAE, then you probably has some large errors. Those big ones suck the squared average skyward.
The direction of your errors tell you if there’s bias. If you’re consistently wrong in one direction, that means there’s bias. If you’ve got a positive bias, you’ll tend to predict too low. If it’s seventy-two, you say it’s going to be seventy. If it’s seventy two, you say it’s going to be seventy. And vice-versa with a negative bias. The tool figures out which one you have.
Then you can separate whether your error is in its direction or its size. Maybe your mean squared error is low, so your predictions are close on average. But maybe your bias is high, so you’re systematically wrong in one direction or another. And this is a distinction people frequently miss. They worry about the size of their error and don’t even consider the systematic direction.
So it’s not just the actual number, but also its context. Two degrees off in a weather prediction isn’t much. But it could mean life and death in medicine when you’re prescribing a dose. Add labels to units. These remind you there must be some context around the number. Look at row level data to understand where the biggest errors are happening. Maybe you can’t predict certain parts of your data as well. Your model works great during the week but falls apart on weekends. Mixing everything together in one number mask those problems.
Those tools are valuable because you can compare them. Having an MSE of 10 isn’t naturaly good or bad. It’s only compared to another model which have an MSE of five. Or you can compare it to a benchmark strategy (e.g., always predict the mean). Very few things will ever get down to zero error. Ideally, you want to minimize error while meeting other requirements. For example, if you are managing inventory, does it matter more if you underestimate demand or overestimate it? Your metric should of reflect those costs.
The calculators don’t pass judgement. These are diagnostic tools. They highlight areas of failure in the model, but don’t tell you why that happens. Examine the data yourself. Decide whether or not the outliers is worth considering or noise. Decide whether or not the bias is acceptable. The math draws a map. You call the shots.
The main goal of all this is understanding what every number mean to your predictions. That’s what the calculator will help with, seeing the data clearly.