Mean Absolute Error Calculator
Paste actual and predicted values to calculate MAE, optional median absolute error, MSE, RMSE, bias, signed errors, absolute errors, squared errors, and baseline comparison.
📌Deep Presets
Load a realistic forecasting or model-validation set, then edit the values, unit label, baseline, precision, and reporting focus.
Enter at least two actual-predicted pairs to calculate MAE.
⚙MAE Inputs
This changes interpretation text; the error formulas stay standard.
Use commas, spaces, tabs, semicolons, or new lines between numbers.
Examples: dollars, orders, minutes, degrees F, kWh, percent points.
Calculations use full precision; this only formats the display.
Baseline MAE helps judge whether predictions beat a simple rule.
Used only when baseline comparison is set to custom constant.
Highlights related rows in the comparison table.
All valid pairs are included even when fewer rows are displayed.
Actual or observed target values. Keep the same number of entries as the predicted list.
Predicted, forecasted, fitted, or estimated values in the same order.
One pair per line. The first number is actual and the second is predicted.
🧮Metric Grid
📋Pairwise Error Table
| # | Actual | Predicted | Error | Absolute Error | Squared Error | Read |
|---|---|---|---|---|---|---|
| Enter paired data to see row-level errors. | ||||||
⚖MAE, MSE, RMSE, and Bias Comparison
| Metric | Formula | Current Value | Best Use | Caution |
|---|---|---|---|---|
| MAE | sum |e_i| / n | 0 | Typical error in original units | Does not show direction |
| Median absolute error | median(|e_i|) | 0 | Robust typical error with outliers | Ignores many small shifts |
| MSE | sum e_i^2 / n | 0 | Optimization and larger-miss penalty | Squared units are harder to read |
| RMSE | sqrt(MSE) | 0 | Original-unit error with outlier penalty | Can be dominated by a few misses |
| Bias | sum e_i / n | 0 | Average overprediction or underprediction | Positive and negative errors cancel |
| Baseline MAE | mean |actual - baseline| | 0 | Simple-rule benchmark | Depends on the baseline chosen |
📊Preset Benchmark Table
| Scenario | Target Unit | Common Scale | MAE Reading | Bias Cue |
|---|---|---|---|---|
| Retail demand | orders | Daily SKU forecasts | Low single-digit order error can be strong | Watch chronic understocking |
| Energy load | kWh | Hourly building demand | Compare MAE with peak and average load | Positive bias means actual above forecast |
| Delivery ETA | minutes | Route time predictions | Median AE helps when traffic creates spikes | Negative bias means estimates run high |
| Weather temperature | degrees F | Daily high forecast | RMSE reveals occasional large misses | Bias shows warm or cool tendency |
| Inventory units | units | Warehouse replenishment | MAE maps directly to buffer need | Positive bias flags short forecasts |
| Home prices | dollars | Valuation model | Use percent MAE or MAPE beside raw dollars | Bias reveals systematic pricing direction |
| Traffic volume | vehicles | Sensor interval counts | RMSE catches incident-period misses | Check rush-hour sign separately |
| Lab assay | mg/L | Calibration validation | Median AE protects against one bad run | Small bias can matter near thresholds |
📐Formula Table
💡Reporting Tips
There’s something about checking the prediction against reality that give you this particular type of anxiety. Before doing the math, you’re looking at a sheet with two columns… One of predictions, one of actuals, and there’s a knot in your stomach. Are you just wildly guessing? Is model any good?
Everyone intuitively leaps to the average error but average error is a trap. It lies to you. Average error is zero if you overestimated by ten units one week, and underestimated by ten the next. The math tell you that you were perfect, but the inventory manager know that you’re wrong.
How to Check Your Prediction Errors
This is where mean absolute error comes in. By removing the signs from all those numbers, we get rid of that issue and instead are left with raw distance between where you thought you were and where you actualy ended up. That’s what this calculator on the page does for you. And it turns those two columns of number into a clear picture of how well (or poorly) you did. It will give you the MAE number.
It will also provide a whole toolkit of other numbers, including bias, mean squared error, root mean squared error, and median absolute error. Each of these paint a slightly different picture of your data.
MAE is the workhorse. It is simple to explain to a boss who does not have career in statistics. If you’re predicting daily orders, then an MAE of five means you are on average off by five units. You have something actionable. It will tell you how much buffer stock to maintain. It’s robust enough for most day-to-day operations and simple enough that no one argues over its definition.
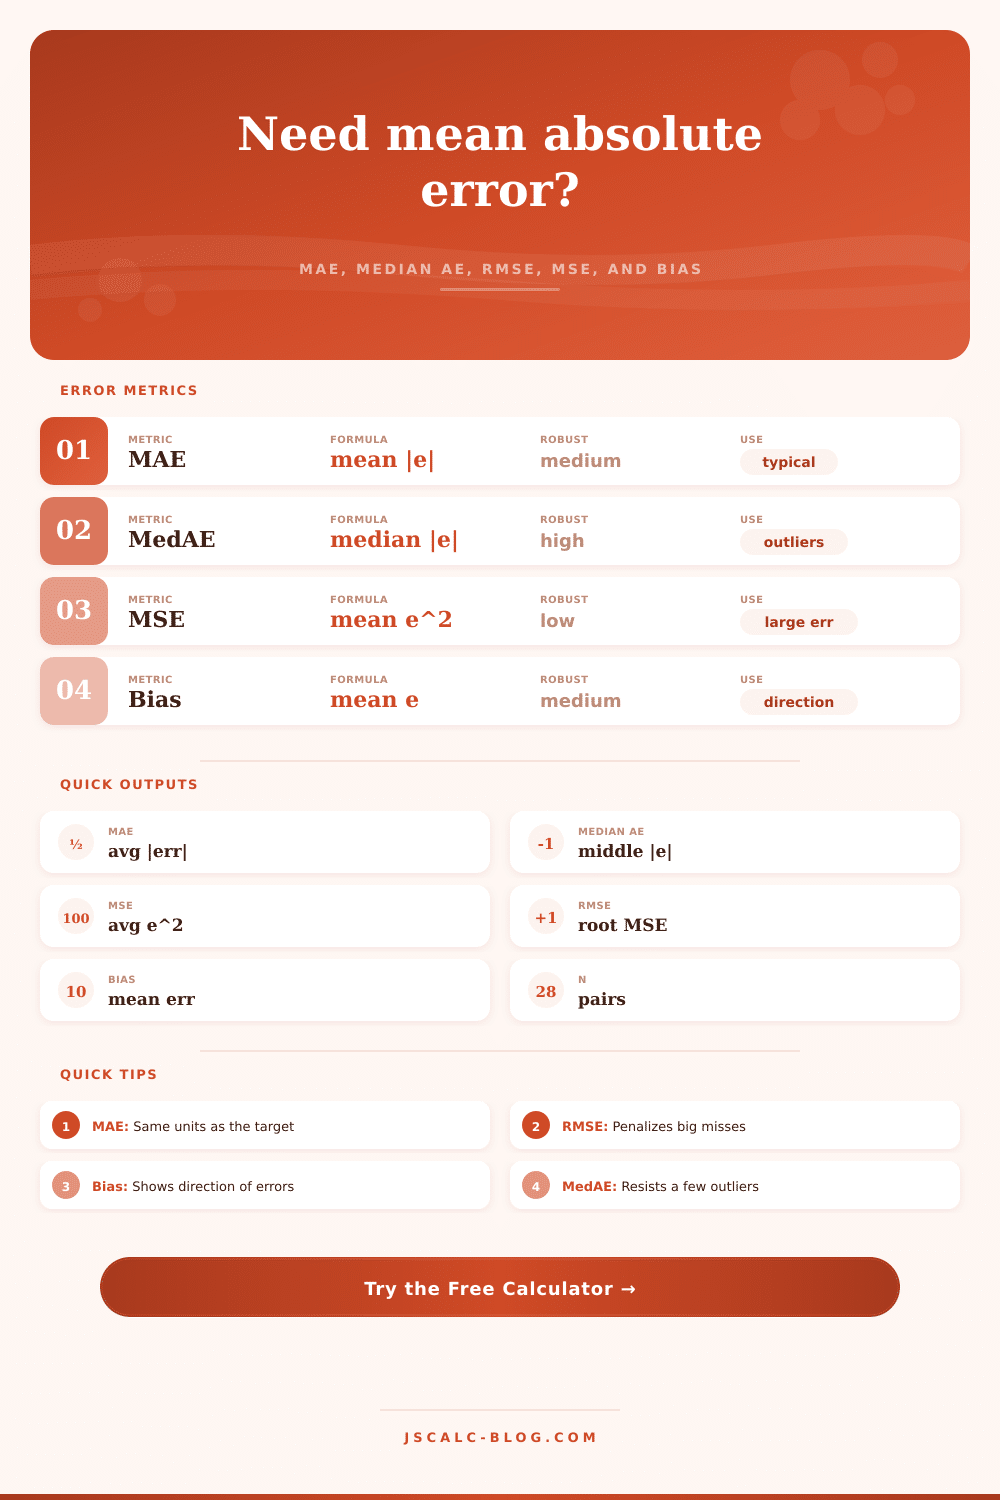
The tool comes with a reference table that lays out the differences clearly; you can pick the right lens based off your specific problem.
The only issue with MAE is that it’s sometimes too forgiving when you’ve got a couple of large miss. Maybe most of the time you’re correct but every now and then you miss by a factor of 10. The MAE will mask these outlying mistakes behind the other smaller ones. So that’s why you see the MSE or RMSE. The MSE squares the error before taking an average, so while a small error gets hit as hard, a big mistake really hurts. Your RMSE should of been a lot larger than your MAE if you have a tail risk problem with your model. The model is stable except for occasional disasters.
Bias is the silent killer. What’s your bias? This will tell you in what direction you’re making more mistakes. If you’re always overshooting (negative bias), you’re overestimating. If you’re always undershooting (positive bias), you’re underestimating. You might also have a terribel bias and a low MAE if your errors cancel each other out. We calculate that for you as well so you can check to see whether or not your model has any consistent bias. It may seem small, but it matters. Often a bias is easier to fix than random variance.
Finally, if you happen to have spikes in your data, then you might want to look at the median absolute error. Because the median only cares about middle value, it’s resistant to outliers. You might have one day with a freak event that blows up your error. The median will stay calm and give you a sense of what the typical experience is like, not letting the extreme cases distort the view.
What happens when you apply those to something like energy load or retail demand? That’s where you see how they play out in real world situations. For retail, we’re balancing overstocks and stock outs which means MAE is king. In energy grids, big misses costs money to instantaneously fix. That means RMSE matters more. It’s all about context. Just because the number is small doesn’t mean it’s a win. Pick a metric that lines up with your cost function.
Perform a baseline comparison. This is a sanity check: does your fancy model outperform simply guessing at the average (or yesterday’s number)? If your MAE isn’t much lower than baseline, maybe you’re overfitting? The model is adding complexity without giving you very much more in return. This is a humbling reminder that simple rules is surprisingly hard to beat.
But finally, there’s no such thing as eliminating error. There’s only managing it. You must measure it so that you can see where it is. In which direction? In the tails? Is it just a function of noise? That gives you an opportunity to begin fixing the problem. You go back to square one, double check the data, and repeat. The math hasn’t changed but you’ve learned more.