Root Mean Square Calculator
Calculate RMS from pasted samples, compare weighted RMS, remove DC offset for AC voltage or ripple, and inspect signal, vibration, and error data with live contribution rows.
Load a real RMS use case, then edit the samples, weights, context, units, or AC handling.
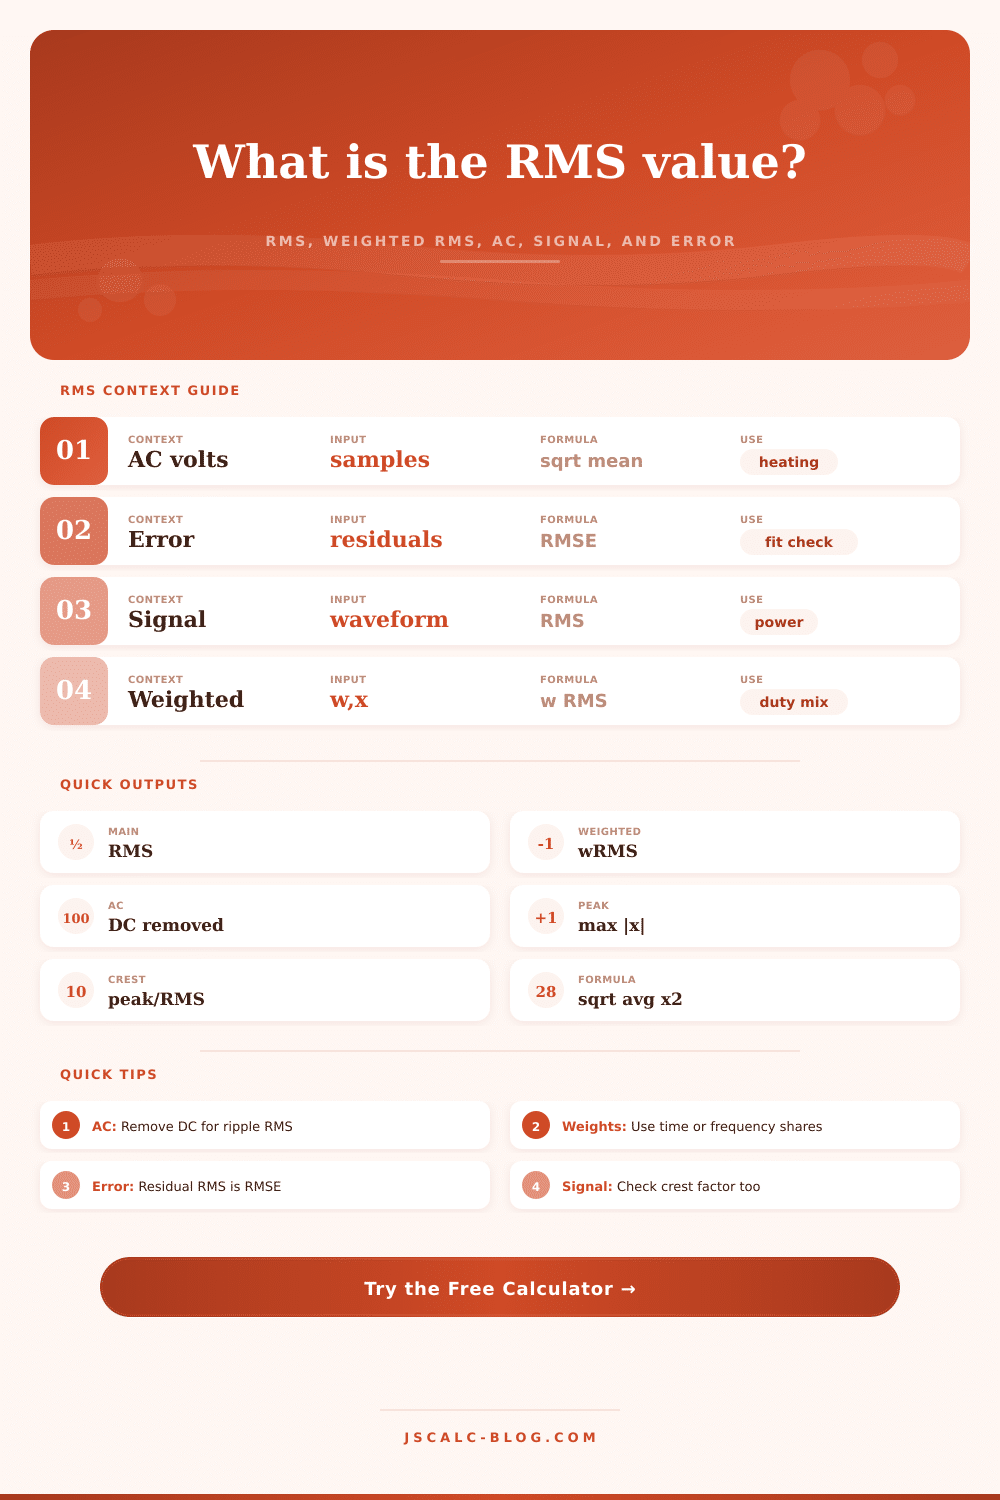
Formula: RMS = sqrt(sum(x^2) / n). Add weights to compute time-weighted, frequency-weighted, or duty-cycle RMS.
Rows show the first 12 parsed samples. Weighted square is the term used by the weighted RMS formula.
| Sample | x | Weight | x^2 | w x^2 | Share |
|---|
| Waveform or Case | Known Relationship | Example Input | Expected RMS | Typical Use |
|---|---|---|---|---|
| Sine wave from peak | RMS = peak / sqrt(2) | 169.71 V peak | 120.00 V | AC mains waveform |
| Sine wave from peak-to-peak | RMS = Vpp / (2 sqrt(2)) | 2.828 Vpp | 1.000 V | Oscilloscope reading |
| Square wave centered | RMS = absolute level | +5, -5 | 5.00 V | Balanced digital drive |
| DC value | RMS = absolute DC | 12 V | 12.00 V | Constant load heating |
| Residual errors | RMSE = sqrt(mean(error^2)) | -2, 1, 3 | 2.16 units | Model accuracy |
| Weighted levels | RMS = sqrt(sum(w x^2) / sum(w)) | 10 V at 25% | Depends on duty | Pulsed load |
| Metric | Formula | Good For | Watch Out |
|---|---|---|---|
| Plain RMS | sqrt(sum(x^2) / n) | Equal-spaced samples | Every sample has equal weight |
| Weighted RMS | sqrt(sum(w x^2) / sum(w)) | Unequal time or frequency | Weights must be nonnegative |
| AC RMS | sqrt(mean((x - mean)^2)) | Ripple, noise, centered signal | Not the same as total RMS |
| Crest factor | max absolute x / RMS | Signal headroom | Very high peaks can dominate |
| RMSE | sqrt(mean(residual^2)) | Error magnitude | Sign is intentionally removed |
In your house, most of energy comes as an AC swing with a frequency of 60 hertz (meaning it cycles between positive and negative 60 times per second). Directly averaging this back and forth won’t get you anywhere, you’ll just end up with zero, which is neither useful nor accurate when measuring power or heat.
Instead, engineers employ something called RMS, which mean take each number, square it so it’s always positive, take the average of all squared numbers, and then apply the square root. What you’re left with is equivalent DC value that will provide the same amount of power. Unlike simply taking the average, this captures true impact of the energy.
What Is RMS and Why It Matters
After plugging in your values from your sample measurements, the calculator figure it out for you. It let you enter current and voltage readings or even expected error measurements. Rather than giving you just one number, it separates it out for you.
This is important because an AC component remove the DC offset before calculating the RMS. That makes a difference when viewing something like ripple on a power supply. What looks like high overall RMS value is realy just the DC constant level being included. That means you’d overvalue how stable your power source actualy is if you didn’t know the difference.
These metrics are all context-specific. For audio, RMS is how loud it sounds, and crest factor shows headroom between the peaks and average levels. If your average level appears OK but you see a high crest factor, that implies it will have big transient spikes which can easily clip your amplifier’s output stage.
The data science formula is for root mean square error. Lower numbers are preferable; only magnitude counts. Sine waves are related to peak values by multiplying by the square root of two (hence the reference table). Novices often gets confused by this constant because they mix up effective voltage with peak voltage.
Intermittent loads add realism based off weighted RMS. Many machine don’t operate at a consistent load all the time. Your motor may be on for one minute at full load and idle for 10 minutes. If your samples aren’t evenly spaced, standard RMS will treat them all equally, distorting your thermal calculation. Adding weight accounts for how long each level remains active. This is critical when estimating battery drain or sizing thermal protection.
Weights is based on the share of time, frequency, or importance. They’re not arbitrary multipliers.
RMS is NOT an average, Many folks think RMS is just a kind of average and stop there. But it’s not. Because we square before summing, it punishes outliers harder then averaging would. Rare but large spikes in voltage will pull the RMS higher quite a bit.
That’s where a crest factor is a helpful co-metric: it tells you if those rare voltage peaks are dominating the energy budget. Are you trying to size a system for average load or maximum transient? This knowledge is critical for design. The calculator shows you both so you can understand the tradeoff. You could of not get the best results by focusing on one without understanding the other.
The RMS bridges that world of unchanging design with that of constantly shifting reality. It compares the static DC reference signal with chaos of what is being measured. Audio fidelity? Grid voltage? Prediction accuracy? Whatever it is, you want to understand how well it perform under the varying conditions.
How much does it matter? That’s where the tool comes in, it provides the numbers. Your task is to apply those numbers within constraints of what matters most to you. Height doesn’t mean anything if there isn’t sustained pressure behind it. That difference turns a statistical equation into practical engineering insight.