Rental Yield Calculator
Enter a property purchase price, monthly rent, annual operating expenses and vacancy rate to find gross rental yield, net rental yield, annual net operating income, cap rate and the gross rent multiplier. This is a pure income and percentage-return tool, so it ignores mortgages and taxes and focuses only on how hard the property works per dollar of price.
🎯Real Property Presets
💵Property and Income Inputs
Contract price paid for the property.
Added to price for total cost basis in net yield.
Gross scheduled rent before any costs.
Share of annual rent lost to empty months.
Yearly local property tax bill.
Landlord or hazard policy per year.
Upkeep, turnover and capital reserves.
HOA dues, utilities or fees you pay.
Manager fee on rent after vacancy.
Rounding for every yield and rate shown.
🔢Formula Snapshot
🌐Typical Gross Yields by Market Type
| Market Type | Gross Yield Range | Price to Rent Feel | Example |
|---|---|---|---|
| Prime coastal metro | 3% to 5% | Expensive, low rent ratio | $900k, $3,000/mo |
| Major city suburb | 5% to 7% | Balanced growth market | $400k, $2,200/mo |
| Midsize Sun Belt city | 7% to 9% | Solid cash flow zone | $250k, $1,700/mo |
| Affordable Midwest metro | 9% to 12% | High rent to price | $120k, $1,050/mo |
| Small rural town | 10% to 14% | Cheap, thinner demand | $80k, $850/mo |
| Student housing area | 8% to 11% | Strong rent per bed | $300k, $2,400/mo |
| Luxury vacation zone | 2% to 4% | Appreciation focused | $1.2M, $3,500/mo |
| Class C workforce area | 10% to 13% | Higher risk and turnover | $110k, $1,100/mo |
📊Net Yield Quality Bands
| Net Yield | Rating | What It Signals | Investor Action |
|---|---|---|---|
| Below 3% | Poor | Income barely covers costs | Only if strong appreciation |
| 3% to 4% | Weak | Thin margin, low buffer | Negotiate price or rent |
| 4% to 5.5% | Okay | Typical balanced market | Acceptable core hold |
| 5.5% to 7% | Good | Healthy cash flow cushion | Strong buy candidate |
| 7% to 9% | Strong | High income per dollar | Verify expenses are real |
| Above 9% | Aggressive | Great yield or hidden risk | Inspect area and vacancy |
🧾Expense Ratios and the 50% Rule
| Expense Line | Typical Share of Rent | On $1,800/mo Rent | Notes |
|---|---|---|---|
| Property tax | 10% to 18% | $180 to $324/mo | Varies widely by state |
| Insurance | 4% to 8% | $72 to $144/mo | Higher in storm zones |
| Maintenance and capex | 8% to 12% | $144 to $216/mo | Older homes cost more |
| Property management | 8% to 10% | $144 to $180/mo | On collected rent |
| Vacancy allowance | 5% to 8% | $90 to $144/mo | One empty month is 8.3% |
| HOA and other | 0% to 10% | $0 to $180/mo | Condos carry HOA dues |
| All operating costs | Near 50% | About $900/mo | The classic 50% rule |
🏢Cap Rate Ranges by Asset Class
| Asset Class | Typical Cap Rate | Risk Profile | GRM Feel |
|---|---|---|---|
| Class A apartments | 4% to 5.5% | Lowest risk, prime areas | High GRM 14 to 20 |
| Class B apartments | 5.5% to 7% | Stable middle market | GRM 11 to 15 |
| Class C apartments | 7% to 9% | Higher risk workforce | GRM 8 to 12 |
| Single family rental | 5% to 8% | Broad demand, easy exit | GRM 11 to 18 |
| Small multifamily | 6% to 8.5% | Duplex to fourplex | GRM 9 to 14 |
| Short term rental | 6% to 12% | Seasonal and variable | GRM varies widely |
| Rural single family | 8% to 12% | Thin market liquidity | Low GRM 6 to 10 |
🗃Price vs Rent Yield Comparison Grid
| Purchase Price | Monthly Rent | Annual Rent | Gross Yield | Est Net Yield | Cap Rate | GRM |
|---|---|---|---|---|---|---|
| $120,000 | $1,150 | $13,800 | 11.50% | 6.90% | 7.19% | 8.7 |
| $180,000 | $1,500 | $18,000 | 10.00% | 6.00% | 6.25% | 10.0 |
| $250,000 | $1,800 | $21,600 | 8.64% | 5.18% | 5.40% | 11.6 |
| $300,000 | $2,100 | $25,200 | 8.40% | 5.04% | 5.25% | 11.9 |
| $400,000 | $2,600 | $31,200 | 7.80% | 4.68% | 4.88% | 12.8 |
| $550,000 | $2,900 | $34,800 | 6.33% | 3.80% | 3.95% | 15.8 |
| $700,000 | $3,500 | $42,000 | 6.00% | 3.60% | 3.75% | 16.7 |
| $900,000 | $4,200 | $50,400 | 5.60% | 3.36% | 3.50% | 17.9 |
| $1,200,000 | $3,500 | $42,000 | 3.50% | 2.10% | 2.19% | 28.6 |
⚙Formula Breakdown
💡Yield Rules of Thumb
What’s my potential rental yield? That’s the first (and most important) question on every property investor’s mind: How much will I earn from owning this building compared to what I paid for it? By expressing rent as a percentage of price, we get rental yield which lets us compare an inexpensive Midwest duplex to an overpriced coastal condo on even footing.
With simple inputs, the rental yield calculator calculates gross rental yield, net rental yield, annual net operating income, cap rate, and gross rent multiplier. In other words, you’ll be able to quickly assess a deal without firing up your spreadsheet. It ignores taxes, financing, and mortgage. This is critical because those depend on your personal bank loan terms. The rental yield calculator measure the asset itself.
How to Use the Rental Yield Calculator
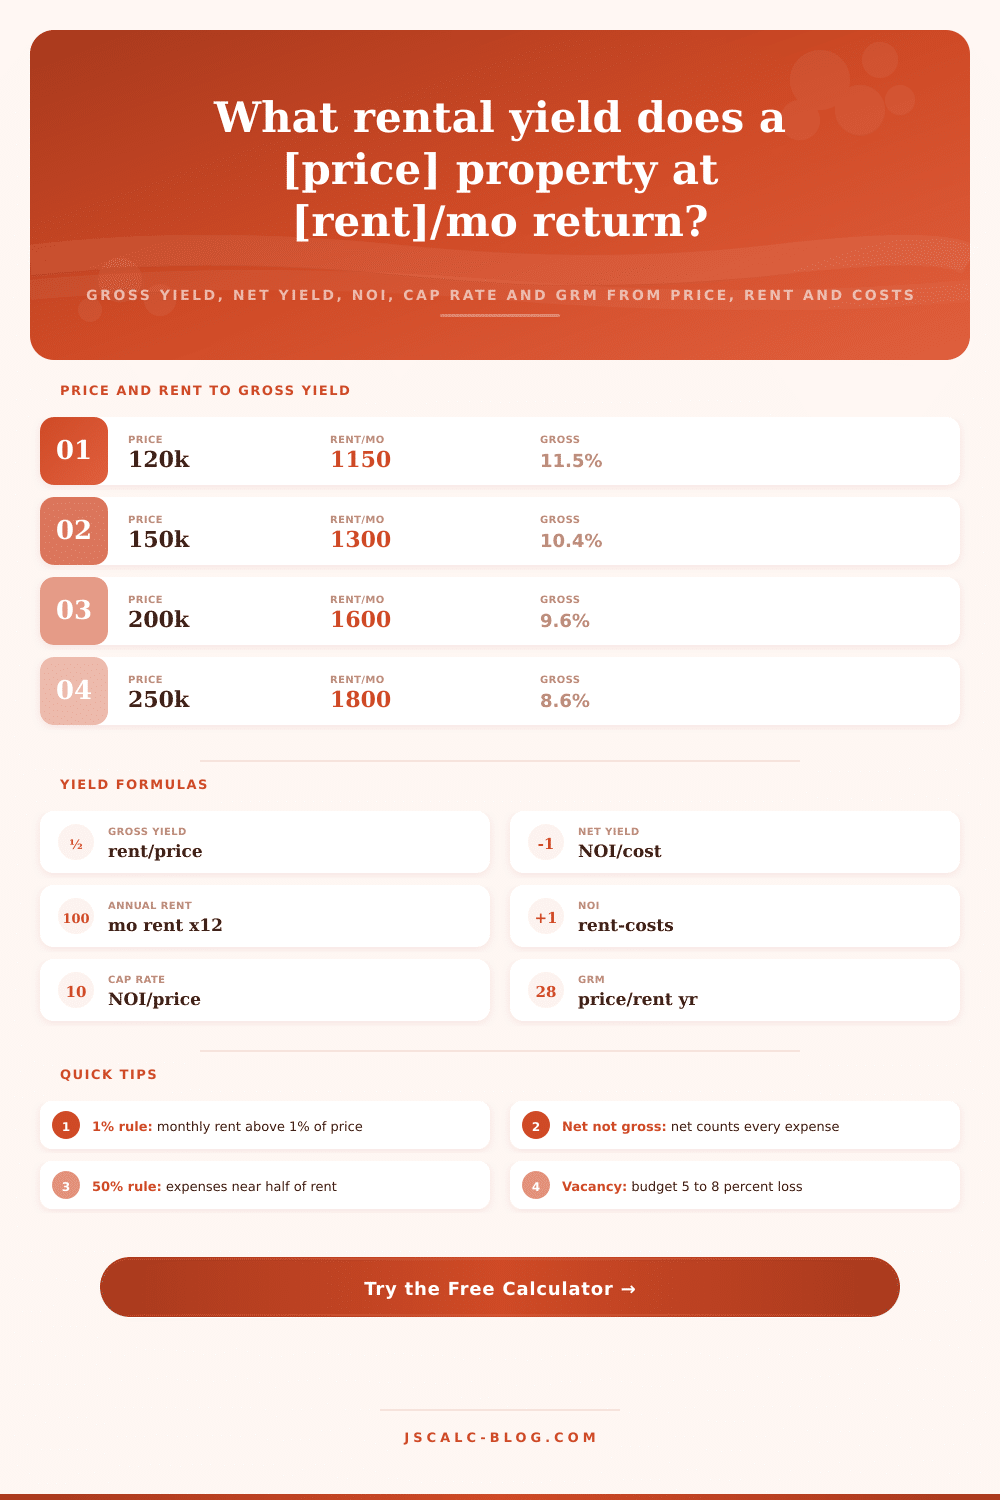
The easiest metric, and the one most listings will initially cite, is gross rental yield. Take the annual rent, divide by the purchase price, then multiply by one hundred. If your property rents for $1,800 per month, that’s $21,600 annually. Against a purchase price of $250,000, that’s a gross yield of 8.64 percent. Useful (fast) and always looks better in real life.
Gross yield ignores all costs. It’s useful because it provides a quick screening tool, two properties could have the same gross yield yet produce wildly different amounts of profit when you count repairs, insurance, and taxes. Agents love quoting this headline number. It doesn’t push you any further. That is why the calculator won’t let you stop here.
But this is the number that matters: Net rental yield. Here’s how the calculator begins: It assumes your annual rent. Then it takes out a vacancy allowance (to account for months when the house sits vacant). Next, it deducts your property management fee; HOA dues; maintenance expense; insurance; and property tax. This leaves you with net operating income.
You divide that income by the sum of all costs… Including the purchase price plus closing costs. And voila! This is your net yield. With our $250,000 illustration (assuming about $9,000 in annual expense, and a six percent vacancy rate), your net yield will come in at around five percent. The spread between gross, 8.64 percent (and net)… Five, says everything you need to know about operating costs, the area where rookie landlords can be taken aback by the realties of being a landlord.
For serious real estate analysis, we’re talking about Net Operating Income, or NOI. This represents the annual income produced by the property before the payment on any loan: this is an assessment of the property itself, not of how you finance it. From there, you simply divide the NOI by the purchase price, then multiply by one hundred and you’ve got your cap rate in hand! Cap rate is common language of both residential and commercial investing. You’ll say that a deal trades at a five cap or a seven cap and people will know what you mean right away.
The calculator tells you both the monthly and annual amount of NOI. In other words, how much cash does the property spit out before debt service? A simple relative value indicator (which doesn’t replace net yield) is the gross rent multiplier, or GRM: divide the purchase price by the yearly rent. If the price = roughly eleven-and-a-half years of rent, then its GRM = 11.6. The lower the multiplier, the better, typically meaning strong relative income vs. Price. High multipliers (common in expensive appreciation markets) tell you you’re paying a higher price per dollar of rent. You’ll see GRM used as a shorthand when scanning lots of listings; it’s a good rule of thumb (though not a replacement) if you’re looking for one number to sort them by.
New investors get tripped up by two types of inputs more than anything else: Management, and Vacancy. Property management typically runs eight to 10 percent of collected rent. Five to eight percent for vacancy, one vacant month per year, is realistic as well. It’s 8.3 percent of the year.
The 50 percent rule has served seasoned investors well. They notice that after averaging in capital items, turnover, repairs, and other costs, operating expenses; not including the mortgage… Tend to eat up roughly half of gross rent over the long term. The calculator won’t compute the numbers if your estimated expenses are significantly less than half, but it pays to ask yourself what you may have forgot… Optimism isn’t a strategy.
To place results into context, the tool displays them alongside some tables below the calculator. The market table gives an idea that gross yields are normaly around three to five percent in top coastal cities (and double digit in cheaper rural and Midwest markets). There’s also a quality band table which rates net yields… Ranging from poor (7%), along with a suggested action for each.
An expense table breaks out the 50 percent rule line by line to show how taxes, insurance, maintenance, management, and vacancy take a portion of your rent. There’s also a cap rate table that shows normal cap rates for different asset classes, from short term rentals to Class A apartments. There is also a wide comparison grid that shows how numbers like gross yield, net yield, cap rate, and GRM change as price increases relative to rent. They’re all benchmarking tools to understand whether your results are good…or just plain lucky.
To play around with the math, there are ten presets that load realistic deals. Try one of these: a $250k condo renting for $1,800 per month, a $400k single family home renting for $2,600, a $120k turnkey rental bringing in $1,150 per month, or a high-cost $700k property cash-flowing for $3,500. See how the yields drop with price increases. Every preset populates all fields and refreshes automatically, and you can change any parameter to run your own scenario. Results update in real time.
The breakdown shows each deduction from rent down to NOI. The print button gives you a clean summary to save to your files. It’s all about getting comfortable with the numbers before putting real money behind it.
There’s more than one lens through which to view yields: Yield is just one, but it’s a strong one because it strips a deal down to income per dollar of price. Thin net yield + a high gross yield = watch out! Someone is eating your return. A solid net yield and a modest gross yield mean it is possibly well run and in a stable area. Rent/offer price that hits your target return.
The Rental Yield Calculator puts Gross yield, Net yield, Cap Rate, NOI, and GRM side by side. This lets you compare properties fairly, spot deals that look good but aren’t, and set your offer or rent price based on your target return. Start with a preset, enter your own numbers, and let the percentage do the talking, because the building will work for you…only if you understand exactly how hard it’s working for you.