Power for a Proportion Test Calculator
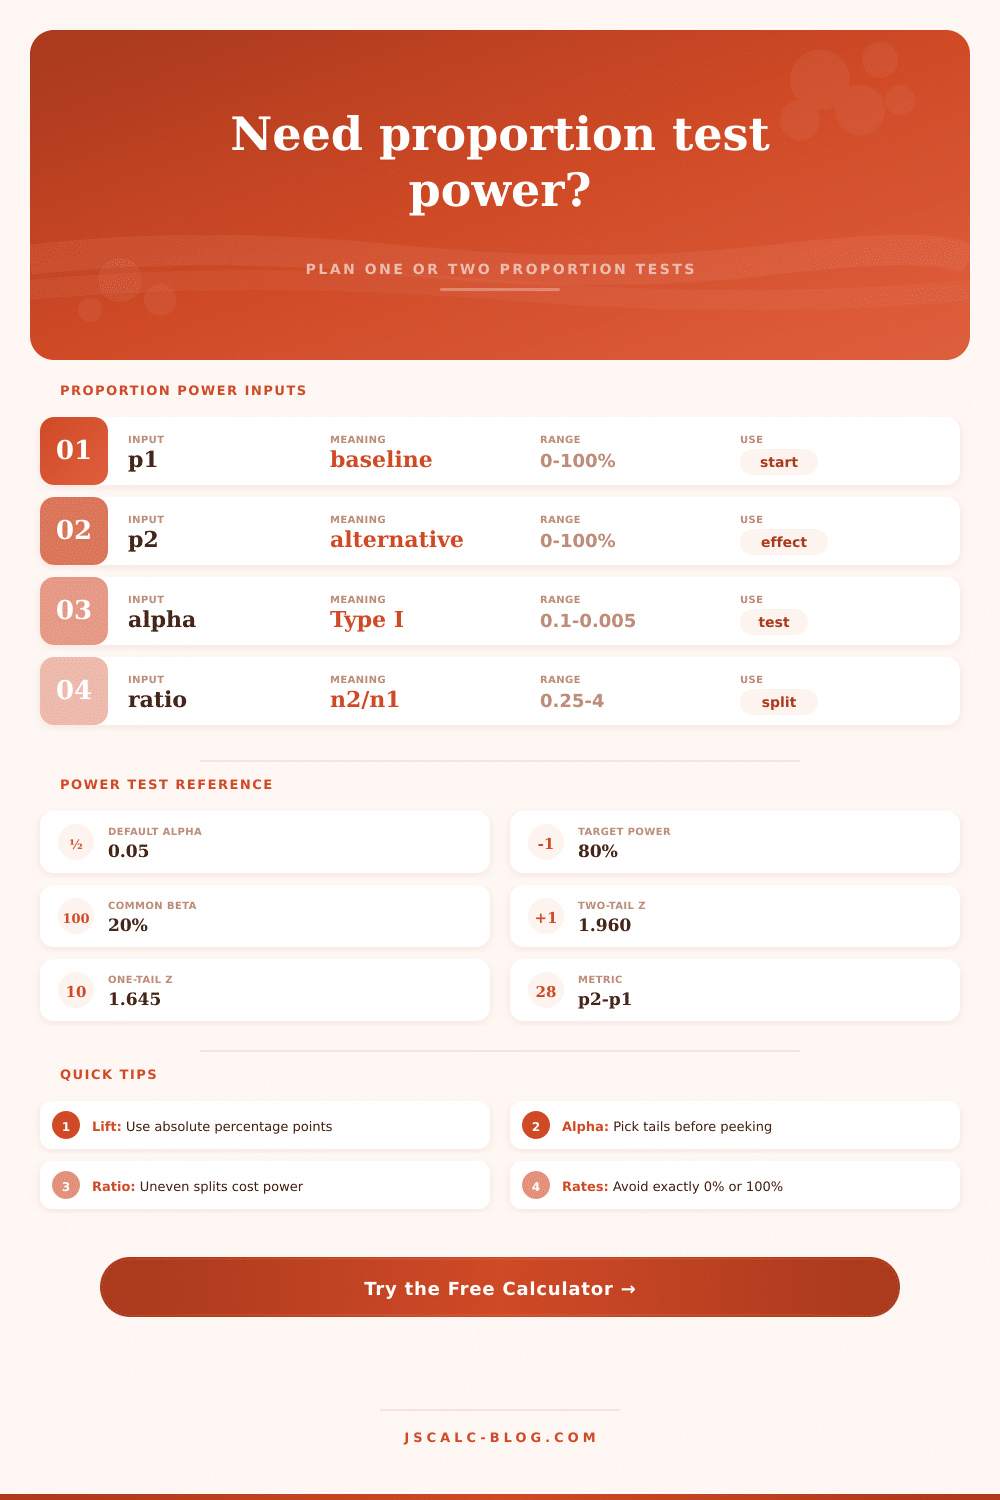
Estimate achieved power for one-proportion or two-proportion z tests. The calculator uses the null or pooled standard error to set the critical cutoff, the alternative standard error to compute power, and searches sample size for your target power.
🎯Proportion Power Presets
📝Test Design Inputs
Two-proportion mode compares treatment p2 with baseline p1.
Choose the direction before analyzing observed results.
Two-sided tests split alpha across both tails.
This determines the z beta reference and required n search.
For one-proportion mode, this is the null benchmark p0.
The absolute lift is p2 - p1 in percentage points.
In one-proportion mode this is the total sample size.
Used in two-proportion mode; 1 means equal groups.
🔢Current Test Snapshot
📐Formula Breakdown
📊Critical Z Reference
| Alpha | Two-Sided zα | One-Sided zα | 80% zβ | 90% zβ | Typical Use |
|---|---|---|---|---|---|
| 0.10 | 1.645 | 1.282 | 0.842 | 1.282 | Screening design |
| 0.05 | 1.960 | 1.645 | 0.842 | 1.282 | Standard test |
| 0.025 | 2.241 | 1.960 | 0.842 | 1.282 | Stricter one test |
| 0.01 | 2.576 | 2.326 | 0.842 | 1.282 | Confirmatory test |
| 0.005 | 2.807 | 2.576 | 0.842 | 1.282 | Very strict alpha |
| Power 95% | varies | varies | 1.645 | 1.645 | Low beta risk |
🧪Common Proportion Power Scenarios
| Scenario | Test Type | p1 or p0 | p2 | Lift | Usual Tail | Planning Note |
|---|---|---|---|---|---|---|
| Checkout conversion | Two proportion | 10% | 12% | +2 pp | Greater | Large n for small lifts |
| Defect reduction | Two proportion | 8% | 5% | -3 pp | Less | Lower is better |
| Survey support | One proportion | 50% | 56% | +6 pp | Two-sided | Near 50% has high variance |
| Clinical response | Two proportion | 42% | 51% | +9 pp | Greater | Direction should be pre-set |
| Retention program | Two proportion | 68% | 72% | +4 pp | Greater | Moderate baseline variance |
| Benchmark pass rate | One proportion | 60% | 70% | +10 pp | Greater | Single group vs target |
| Adverse event drop | Two proportion | 22% | 18% | -4 pp | Less | Watch total event count |
| Pilot signal | Two proportion | 15% | 22% | +7 pp | Two-sided | Wide uncertainty |
⚖Allocation Ratio Reference
| Ratio n2/n1 | Split Share n2 | SE Impact | When It Appears | Design Caution |
|---|---|---|---|---|
| 0.25 | 20% | Much higher | Scarce treatment cases | Power drops fast |
| 0.50 | 33% | Higher | Limited variant exposure | May need more total n |
| 1.00 | 50% | Lowest for equal cost | Most A/B tests | Best default split |
| 1.50 | 60% | Slightly higher | More traffic to variant | Small efficiency loss |
| 2.00 | 67% | Higher | Ethical or rollout reasons | Control group thins |
| 4.00 | 80% | Much higher | Rare control allocation | Often expensive in total n |
🔍Comparison Grid for Test Designs
| Design | Mode | Baseline | Alternative | Lift | n1 Start | Ratio | Alpha | Tail | Best Read |
|---|---|---|---|---|---|---|---|---|---|
| A/B conversion lift | Two | 10% | 12% | +2 pp | 5000 | 1.00 | 0.05 | Greater | Growth test |
| Manufacturing defects | Two | 8% | 5% | -3 pp | 800 | 1.00 | 0.05 | Less | Quality gain |
| Benchmark pass rate | One | 60% | 70% | +10 pp | 180 | 1.00 | 0.05 | Greater | Single sample |
| Support survey | One | 50% | 56% | +6 pp | 900 | 1.00 | 0.05 | Two | Poll shift |
| Clinical response | Two | 42% | 51% | +9 pp | 420 | 1.00 | 0.05 | Greater | Response gain |
| Retention campaign | Two | 68% | 72% | +4 pp | 800 | 0.75 | 0.05 | Greater | Uneven split |
| Traffic ramp test | Two | 4.8% | 5.4% | +0.6 pp | 20000 | 1.50 | 0.05 | Greater | Tiny lift |
| Pilot signal check | Two | 15% | 22% | +7 pp | 120 | 1.00 | 0.10 | Two | Early evidence |
💡Practical Power Tips
With a combination of glee and fear you fire off the new checkout button. Traffic flows. Launch is live. And then… nothing. There is no data yet.
You wonder if maybe your sample size wasn’t large enough to pick up on even a minor enhancement if there were one. That’s where statistical power comes in, an insurance policy that ensures you don’t miss out on detecting a true result. This tool above will estimate the likelihood that you’ll be able to find a difference between two proportion based off your design parameters.
Why You Need to Plan Your Test Before You Start
The typical metric used to decide if something is significant is called alpha (and this is what most folks refer to as “significance level”). The flipside is power: it is the probability that we reject the null hypothesis given that alternative is true. If you have low power, you’re betting that you’ll see what’s actually happening, but in fact you might not.
Statisticians call this beta risk, which is the risk of failing to detect something when it’s realy there. That’s a bad bet to make. Minimize that error.
In either case, one- or two-sample, the calculator do all the hard work. With a two-proportion test, that means you’re testing whether a new treatment rate is different than some kind of baseline rate. You input your assumed baseline, the hoped-for lift, and how many samples you intend to take. It then spits out the probability that your null and alternate distributions will be close enough together (or not) so that you can make an educated guess about what’s going on.
And this is where folks go astray: they think if only their sample size was larger, they’d have more power. But they don’t account for how variable their proportions might be. Take that as a hint to consider the base rate itself. If your base rate is closer to ten percent, you have less variance. A conversion rate of half would represent maximum variance. Because of this, you require fewer observations to see the same level of absolute lift then if your base rate were closer to 50%.
The tool adjusts its standard error according to the specific proportions you input, in other words, it doesn’t presume a constant degree of variance regardless. That’s what makes a general-purpose sample size table fall short. You want the math to be about your own base case, not some average for your industry.
A trickier aspect is allocation ratios. In general, using as much of your data as possible is best; if you skew your allocations, for example by sending 80% of traffic to the control group, then you’re wasting some of your data. Precision depend on how many people are in each group. With the calculator, you can change this ratio and observe that the more you skew things, the more you dilute your power.
When you’re trying to justify running a test, every little bit helps, so you may discover that moving only ten percent of your traffic back to an even split will increase your power a lot.
So what should you do when you look at the outputs? Focus on required sample size and achieved power. Required sample size tells you how many more users you need to reach your target. Achieved power tells you about the sensitivity of your current plan: if it’s less than eighty percent, there’s a high probability that you’ll miss modest effects.
In other words, it’s a simple trade-off between precision and time. Do you want to be precise (accepting the possibility of a false negative)? Or do you want to run the test longer?
To anchor all of this in reality we have some reference tables on the page to illustrate what happens when you change the direction of tails or the significance (alpha) level. You see the critical value changes as a result. When you’re sure that the effect is going one way or the other, you’ll get more power from a one-sided test, but you also bear greater scientific and ethical responsibility for getting it right.
Before you look at the data, you need to decide. If you change your mind midway through, then the math should of been off. But really, power analysis is all about setting reasonable expectations. It avoids a heartbreaking null (which could simply be an underpowered failure).
The calculator does this math for you, taking out the guesswork. It makes the abstract world of statistical theory concrete. What can my design find? What can’t it find? It lets you see the answers up front before launching your experiment. It is better than wondering about it afterwards.
With confidence, not just hope, you go off to the races.