Percentage Increase Calculator
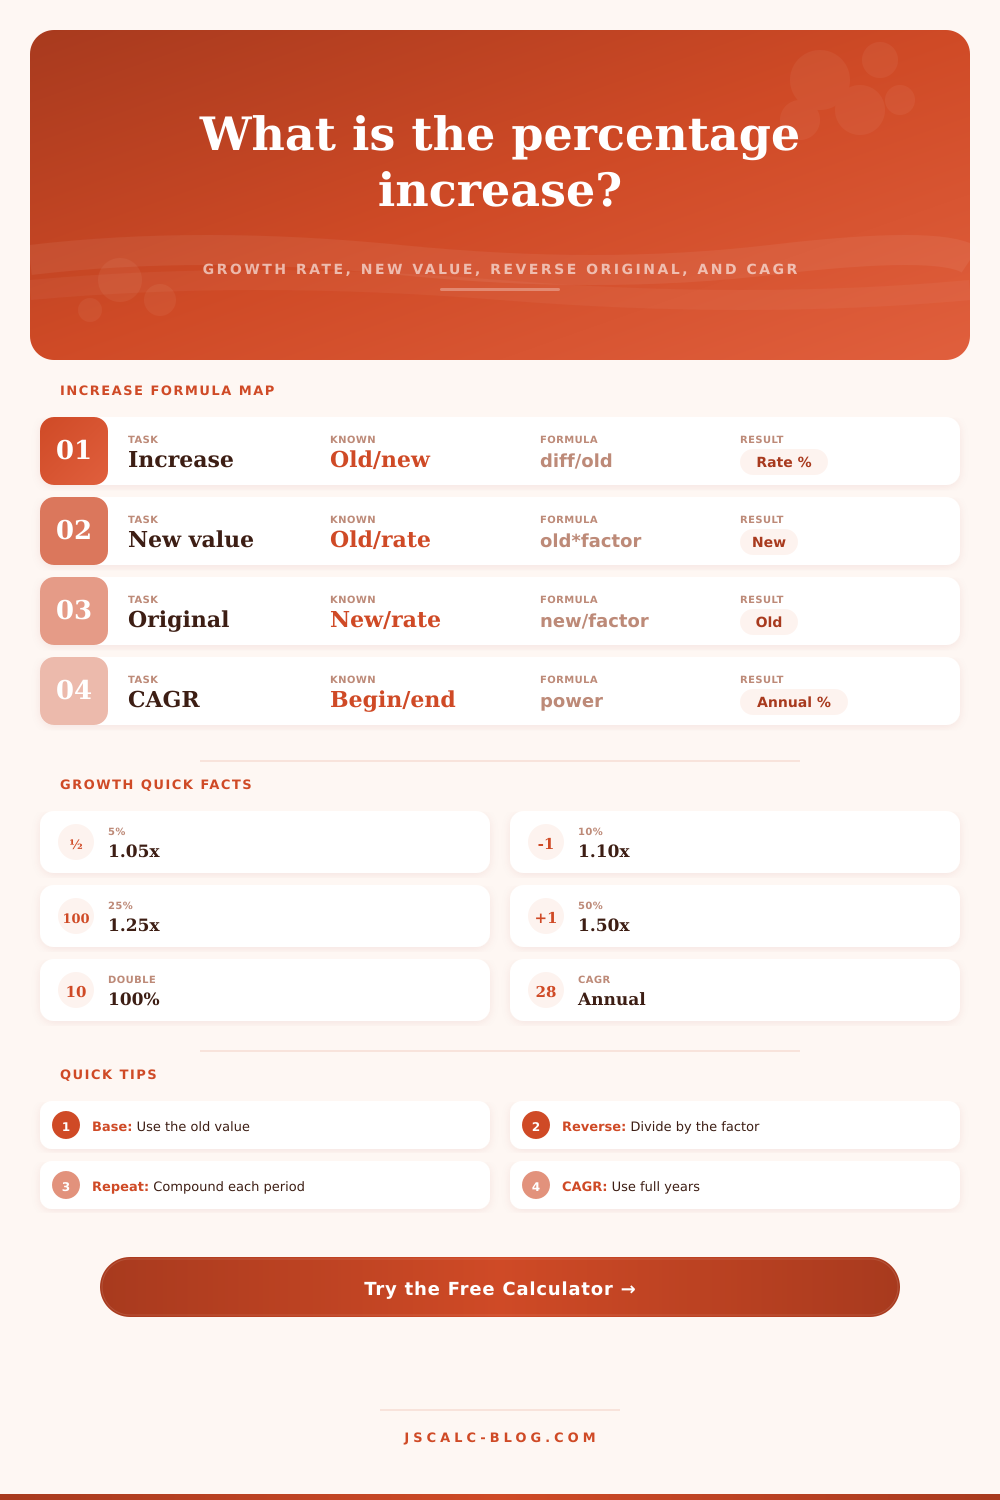
Calculate increase percent, growth factor, new value from a rate, original value before an increase, repeated increases, and CAGR from real growth scenarios.
Used as the base in increase%=(new-old)/old*100.
Enter the final value you reached.
For new value and reverse original calculations.
A 5% increase for 4 periods means old*(1.05)^4.
CAGR uses ending/beginning across full years.
Formula: CAGR=(ending/beginning)^(1/years)-1.
| Growth task | Known values | Exact formula | Main answer | Growth factor | Real use |
|---|---|---|---|---|---|
| Percentage increase | Old and new | increase%=(new-old)/old*100 | Percent up | new/old | Salary, traffic, KPI lift |
| New value | Old and rate | new=old*(1+p/100) | Future value | 1+p/100 | Price, quota, revenue target |
| Reverse original | New and rate | original=new/(1+p/100) | Starting value | 1+p/100 | Back out pre-raise value |
| Repeated increase | Old, rate, periods | new=old*(1+p/100)^periods | Compounded value | factor^n | Monthly or quarterly growth |
| CAGR | Beginning, ending, years | CAGR=(ending/beginning)^(1/years)-1 | Annual rate | end/begin | Multi-year business growth |
| Absolute increase | Old and new | increase amount=new-old | Unit lift | Not required | Output or population gain |
| Increase | Growth factor | Old 100 becomes | Increase amount | Reverse divisor |
|---|---|---|---|---|
| 1% | 1.01x | 101 | 1 | Divide by 1.01 |
| 5% | 1.05x | 105 | 5 | Divide by 1.05 |
| 10% | 1.10x | 110 | 10 | Divide by 1.10 |
| 15% | 1.15x | 115 | 15 | Divide by 1.15 |
| 25% | 1.25x | 125 | 25 | Divide by 1.25 |
| 50% | 1.50x | 150 | 50 | Divide by 1.50 |
| 100% | 2.00x | 200 | 100 | Divide by 2.00 |
| Rate each period | 2 periods | 4 periods | 12 periods | What it shows |
|---|---|---|---|---|
| 2% | 1.0404x | 1.0824x | 1.2682x | Small recurring lift compounds |
| 5% | 1.1025x | 1.2155x | 1.7959x | Common monthly growth target |
| 8% | 1.1664x | 1.3605x | 2.5182x | Fast subscription expansion |
| 10% | 1.2100x | 1.4641x | 3.1384x | Large repeated increase |
| 25% | 1.5625x | 2.4414x | 14.5519x | High-growth case sensitivity |
| Scenario | Beginning | Ending | Years | CAGR formula result |
|---|---|---|---|---|
| Website traffic | 80,000 | 140,000 | 2 | 32.29% per year |
| Subscriber base | 4,500 | 9,200 | 3 | 26.91% per year |
| Population | 125,000 | 138,500 | 5 | 2.07% per year |
| Revenue KPI | 250,000 | 410,000 | 3 | 17.96% per year |
| Production output | 12,000 | 15,900 | 4 | 7.29% per year |
Numbers are nice, especially when they’re on the right side of the ledger. Raw numbers don’t always convey much. How many hours have you spent measuring forward progress? That’s why knowing that you’ve crossed a million in revenue is nice…until you remember that it’s a 10-year climb from nothing. So you start converting these absolute metrics into percentage terms.
Percentages allow you to compare a big company with a small startup… They level the playing field, allowing you to look at speed (not just size). Once you enter the before and after numbers into the calculator above, it do all the math. You don’t need to guess how to convert between coefficients or units of measure. This way, you can focus more on what the change actualy means and apply it to your own plans.
Understanding Percentage Growth and Compound Interest
The error most folks make is mixing up the old number with the new, which is why they come out with the base value. A bump in sales from eighty thousand to one-hundred-thousand is a twenty five-percent increase, but only a twenty percent increase. And it’s the former that counts… Where did you start, not where did you land? That’s a fine point that catches both marketers and analysts off guard.
By using the top end as the divisor, the growth rate appears smaller (as does your progress). Progress looks less impressive then it actualy was. What you want to know is how far you’ve travelled from starting line. That way, you get a sense of true momentum versus just a snapshot of where you happen to be sitting.
The other thing you sometimes want to do is work backwards, to get a sense of what things cost prior to a raise or a price increase. Instead of just subtracting the percentage, you has to divide by the multiplier for that to work. For example, if something is up 15%, then to figure out how much it cost originally, you don’t take away 15% from current price (that’s not right). You divide by one point one five.
It may sound nit-picky, but it avoids compounding errors which can throw your budget off a lot over time. This lets you reverse the calculation and compare prices between periods of time easy, without getting caught up in algebraic knots.
Linear thinking breaks down quickly when your growth occur multiple times, whether quarterly or monthly. Ten percent every month doesn’t equal one hundred percent in ten months, since your starting point continually shifts higher. Business metrics work exactly like compound interest on a savings account. It’s easy to understand with a simple table of references on the page, which demonstrates how small recurring increases adds up to huge multipliers at larger time scales.
One or two percent a month seems minor. However, it compounds year-over-year, adding almost a full quarter (nearly twenty-eight percent!) total growth from compounding. That’s the hard part… But also the beautiful thing. About that exponential curve, as it helps (or hinders) your ability to scale an operation.
The compound annual growth rate (CAGR) smooths out the bumps for longer time periods so you have one metric that’s easy to read. The CAGR answers the following question: If the growth had been consistent, what steady annual rate would I of achieved? The average annual growth rate can be used when comparing two market segments or two investments that has volatile year-over-year change rates. You plug in your starting amount, your ending amount, and the number of years, and voila! It is a nice annual percentage stripped of the quarter-by-quarter noise. No predictions on where this will go, just a standardized yardstick on how well something has done in the past.
This lets data tell stories. It helps you see past the numbers, they become narratives of operational leverage, market capture, and efficiency. Twenty-five percent isn’t just two times greater then ten percent. Ten percent represents some combination of product adoption, pricing power, or customer behavior, and twenty-five percent represent those same things. To get that number correct is to tell that story correctly.
Learn how the compounding period and the base value influence the resulting percentage, and suddenly you’ll be able to interpret any growth chart with new insight. With the right question in mind, the answer’s always there, hiding in plain sight, waiting for you to find it.